The Williston basin, trending across North Dakota, Montana, and into Canada, has been a historically strong producer back to the early 1900s and has experienced a renewed focus due to the shale boom of the last two decades. Although the Williston is by no means played out, recent economic and political developments have called into question whether the play will remain economically viable in the near future. The global demand shortfalls and oil price drops of 2020 are hitting all capital-intensive shale plays, especially hard. However, recent court decisions calling into question pipeline access to Texas refineries could prove an even more decisive obstacle to the short-term prospects of Williston producers. Although prices and refinery access will eventually normalize for the Williston, cash-strapped operators may be looking to get out of the play. Long-term investors looking to buy discounted Williston assets will need an effective method of evaluating these assets but may not have the time or resources to conduct an exhaustive geological or geophysical evaluation. This study outlines a workflow that could be used to evaluate an extensive play like the Williston using only a production dataset and basic geologic assumptions.
The primary obstacle to studying a large, historic basin like the Williston is dealing with the legacy datasets across multiple US states and Canada. Consolidating all the disparate datasets and normalizing key attributes is critical to study plays like the Williston that span multiple state and international boundaries. The TGS Well Performance Database handles a lot of the groundwork, normalizing formations, operators, and fields across state boundaries and converting depths and production volumes from metric to imperial across international boundaries. However, the reported and producing formation naming conventions across the international border require a more thorough comparison and normalization. The different reporting units of the Bakken need to be normalized, and the various formations of the Madison group reported under different names need to be merged, among other minor variations. Normalizing producing formations to a distinct list of major producers allows for a framework to begin interpreting the Williston.
Using the framework described above to interpret the Williston Production dataset we can create some interesting visualizations to identify the performance of our AOI over time. [Figure 1] shows the number of wells drilled to each major producing formation over time, identifying the evolution of which formations and plays have been historically prioritized. [Figure 2] shows the cumulative production from each of the major producing formations, combining the historical priority of wells drilled with the fully realized performance. As expected, there is a sharp increase in Bakken wells drilled in the early 2000s corresponding with a huge uptick in Bakken production as a result of the improvements from unconventional reservoir drilling and completion design. This information is interesting, but it may not provide insights necessary for asset valuation. It is well known that the Bakken can be extremely productive under the right circumstances, but in a basin dominated by lateral heterogeneity, as in the Williston, insights and evaluation should include some aspect of geo-spatial interpretation.
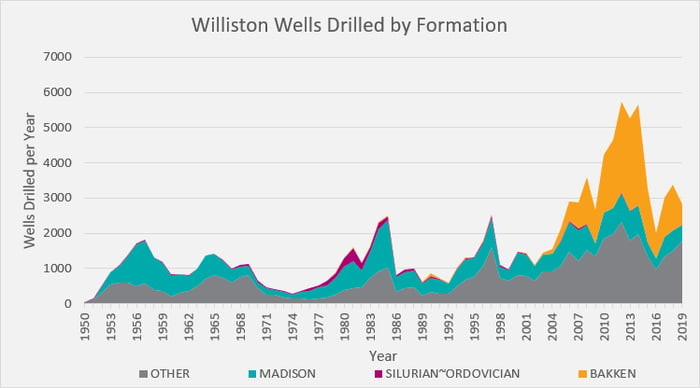 Fig 1 – Number of Wells Drilled Over Time of Williston Producing Formations
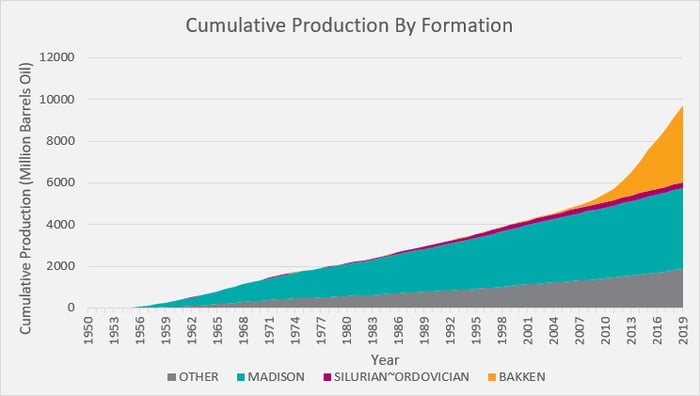
Fig 2 – Cumulative Production Over time of Williston Producing Formations
While production datasets excel at interpreting data on time horizons, they lack all but the most basic definition in the three spatial dimensions. Meanwhile, geological and seismic interpretations excel at interpreting subsurface structures and properties at a snapshot in time. That’s why nearly all interpretation workflows combine some aspect of geologic or geophysical interpretation with production time-derived datasets. However, geological and geophysical interpretations can be costly and time consuming. With a small amount of geo-structural understanding of basins and plays, we may be able to significantly enhance what geo-spatial data is included in production datasets and create more insightful analyses from production data alone.
Based on evidence from the TGS Neptune survey interpretation we can identify a possible Northwest to Southeast trend that could be interesting to study. [Figure 3] shows how seismic tops from Neptune trend downward along the NW to SE trendline. By creating a grid with the reported latitudes and longitudes from the Well Performance dataset and rotating the grid to align with the Neptune trend we can interpret production data along a two-dimensional cross section of that NW to SE trendline. This is a relatively straightforward transformation that can be performed without the use of any mapping or interpretation software. [Figure 4] shows Williston Basin wells with the NW to SE trendline A-A’ overlain on top. A stratigraphic cross-section can be approximated by mapping the average total vertical depth of wells drilled to each major formation [Figure 5], or if a cross-section is available, this can be used to validate the model is aligned properly.
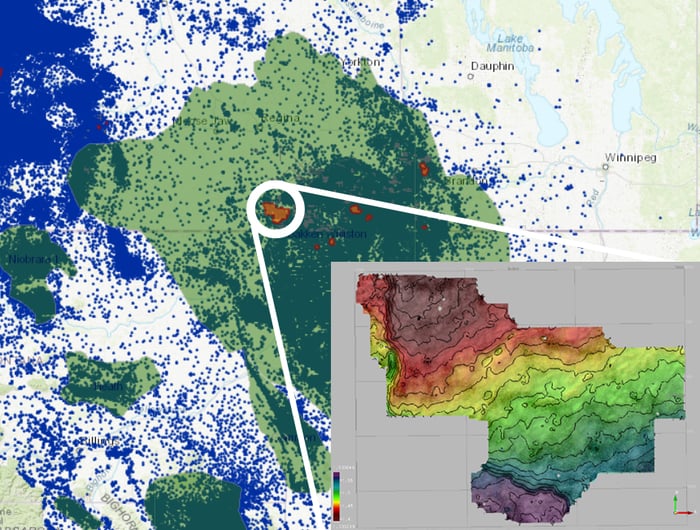 Fig 3 – TGS Neptune Survey Midal Beds Structure
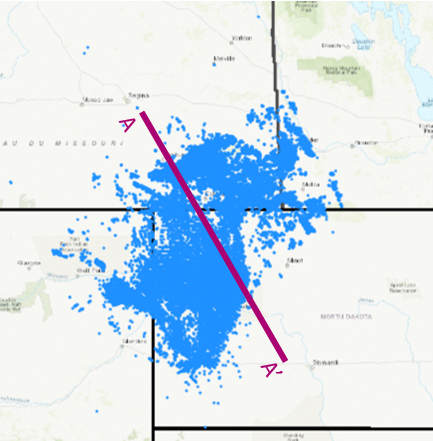
Fig 4 – Williston Basin Map with A-A’ Cross Section
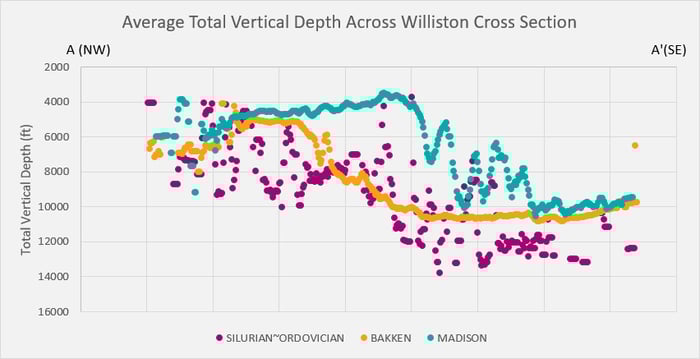
Fig 5 – Average Formation Total Vertical Depth along Williston Cross Section
Finally, the production data by formation can be mapped geo-spatially across the two-dimensional cross-section. These last two figures show not only which formations are the most productive, but where in the structure of the basin each formation is most prominent. [Figure 6] shows the cumulative production across the cross section, identifying the total amount of hydrocarbons extracted, and [Figure 7] shows the average well production for each formation across the cross section. These cross-section production plots quickly illustrate areas of high production. Looking at the number of wells along the cross-section, this seems to be more due to geology, i.e., a few high producers than due to the number of wells, i.e., a larger number of mediocre producers. However, they also show that while the Madison group historically has been produced from more the high side of the structure to the Northwest, Madison wells on the low side of the structure in the Southeast could be more productive on a per well basis.
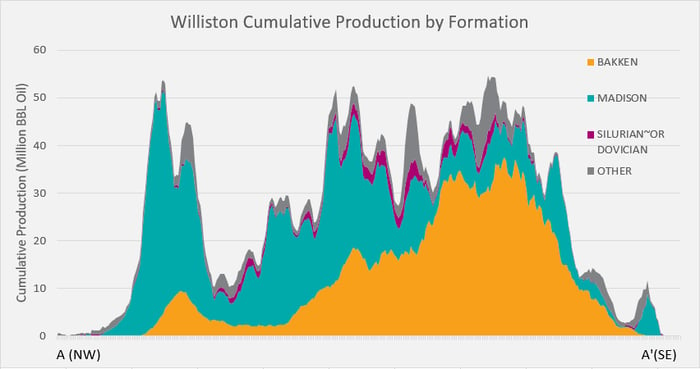 Fig 6 – Cumulative Production Across A-A’ Cross Section
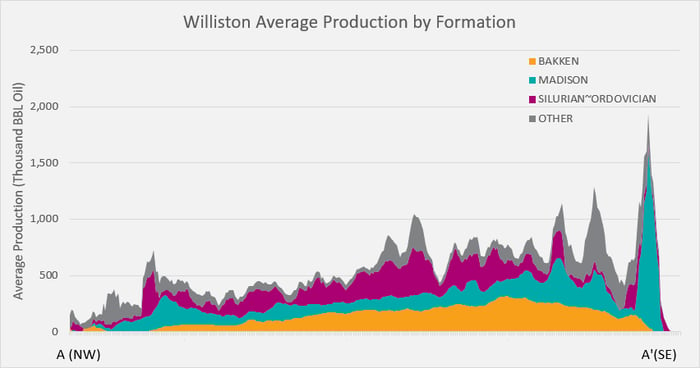
Fig 7 – Average Well Production Across A-A’ Cross Section
The illustrated workflows demonstrate what high-quality data, diligent processing, and end-user-focused software can bring to the table. The question “what does production look like in the entire Williston Basin” seems easy enough but could be tedious to answer considering the different data sources, vintages, formation nomenclatures, and unit systems involved. Thankfully, the TGS Well Performance Data solutions help us quickly evaluate productivity regardless of what side of the border you’re looking at.