In light of recent freezing temperatures in Texas around the one-year anniversary of Winter Storm Uri, we decided to analyze the impacts Uri had on natural gas production and flare volumes at the state and county levels, how a loss of gas production impacts the state energy mix, and the potential costs of implementing weatherization requirements for individual wells and natural gas processing plants to protect against future winter storms.
In Texas, natural gas production took a hard impact from February 10th–20th, plummeting temperatures into single digits. Across the state, records were shattered for minimum temperatures and consecutive days below freezing (≤32°F). Being ill-prepared for such a winter weather event led to massive strains on Texas energy production, including the natural gas sector, which accounts for nearly half of the electric power generation for Texas2).
We analyzed the TGS Well Performance Dataset to investigate. Utilizing the Texas monthly allocated well production dataset, we determined a 16% decrease statewide in gas production from January to February. This decrease in overall production is equal to ~58.5 million MWh of electric energy lost, which equates to ~11.7 million MWh/day. This deficit also caused the industry to miss out on up to $1.3 billion using average spot prices during the storm and aftermath2). In addition, the storm caused freeze-offs at the wellhead, increasing well pressure, which subsequently led to shutting in wells and/or flaring the pressurized gas1). As a result, there was a 33% increase in natural gas flare volumes statewide. Not only does this increase have detrimental impacts on the environment, but it also indicates that ~$21.6 million worth of natural gas was disposed of, or enough energy to power up to 60,000 Texas households.
Methodology:
For this analysis, we are using production figures reported on a monthly basis and assume that the changes in gas production at the well level are equivalent to changes at the consumer distribution level. We converted thousand cubic feet (mcf) to British thermal units (Btu) to determine an approximation of megawatt-hour (MWh) generation where 1 mcf is approximately equivalent to 1,450 Btu and 1 Btu is ~2.931x10⁻⁷ MWh. Month-to-month comparisons were normalized to the number of days in each month, and we made the assumption that variance in production and flare volumes during the month of February mainly occur during the 5 days of most severe weather (February 13th–18th). We used the average spot price of $9.30 over the course of the storm and compared that with the average spot price during January 2021 of $2.71 to gauge monetary losses. To estimate the relative number of households effected, we used northern European winter electricity usage (~3,300 kWh per month11) ) and estimated it for the 5 worst days of the storm.
We determined the top ten natural gas-producing counties in Texas during January 2021 using TGS Longbow and the Well Performance Dataset. These counties are overlayed on the temperature and duration maps in Figure 13). The figures show a correlation between minimum temperatures in Eastern Texas and the duration of consecutive days below freezing in Western Texas, with overall production declines and flaring increases (Figure 1). The Eastern Counties of Panola and Harrison underwent record-breaking minimum temperatures of -3°F or less indicated by the blue shading on the right-most map (Figure 1A).
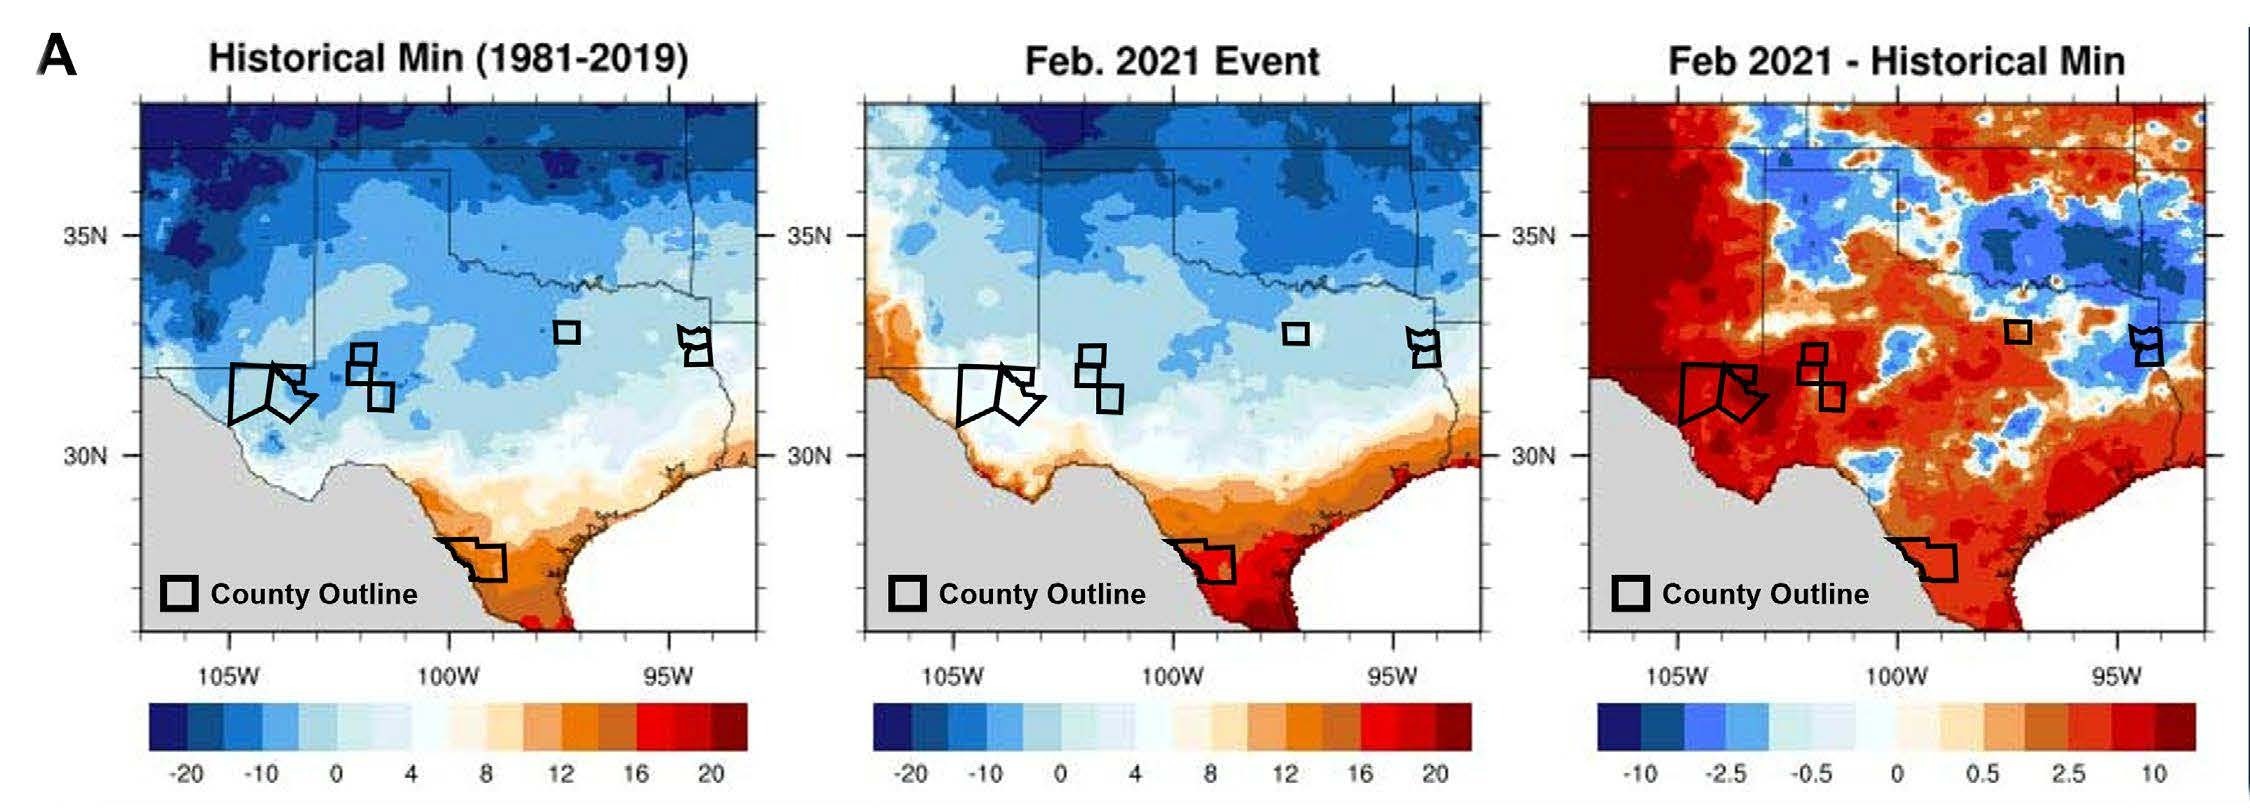 Figure 1A – Minimum surface temperature in Degrees Fahrenheit for the Historical Record (left) and the February 2021 Event (middle). Difference between the minimum temperature for February 2021 event and the Historical Record (right) map indicates regions where the 2021 event was the coldest in the most recent record (blue shading).
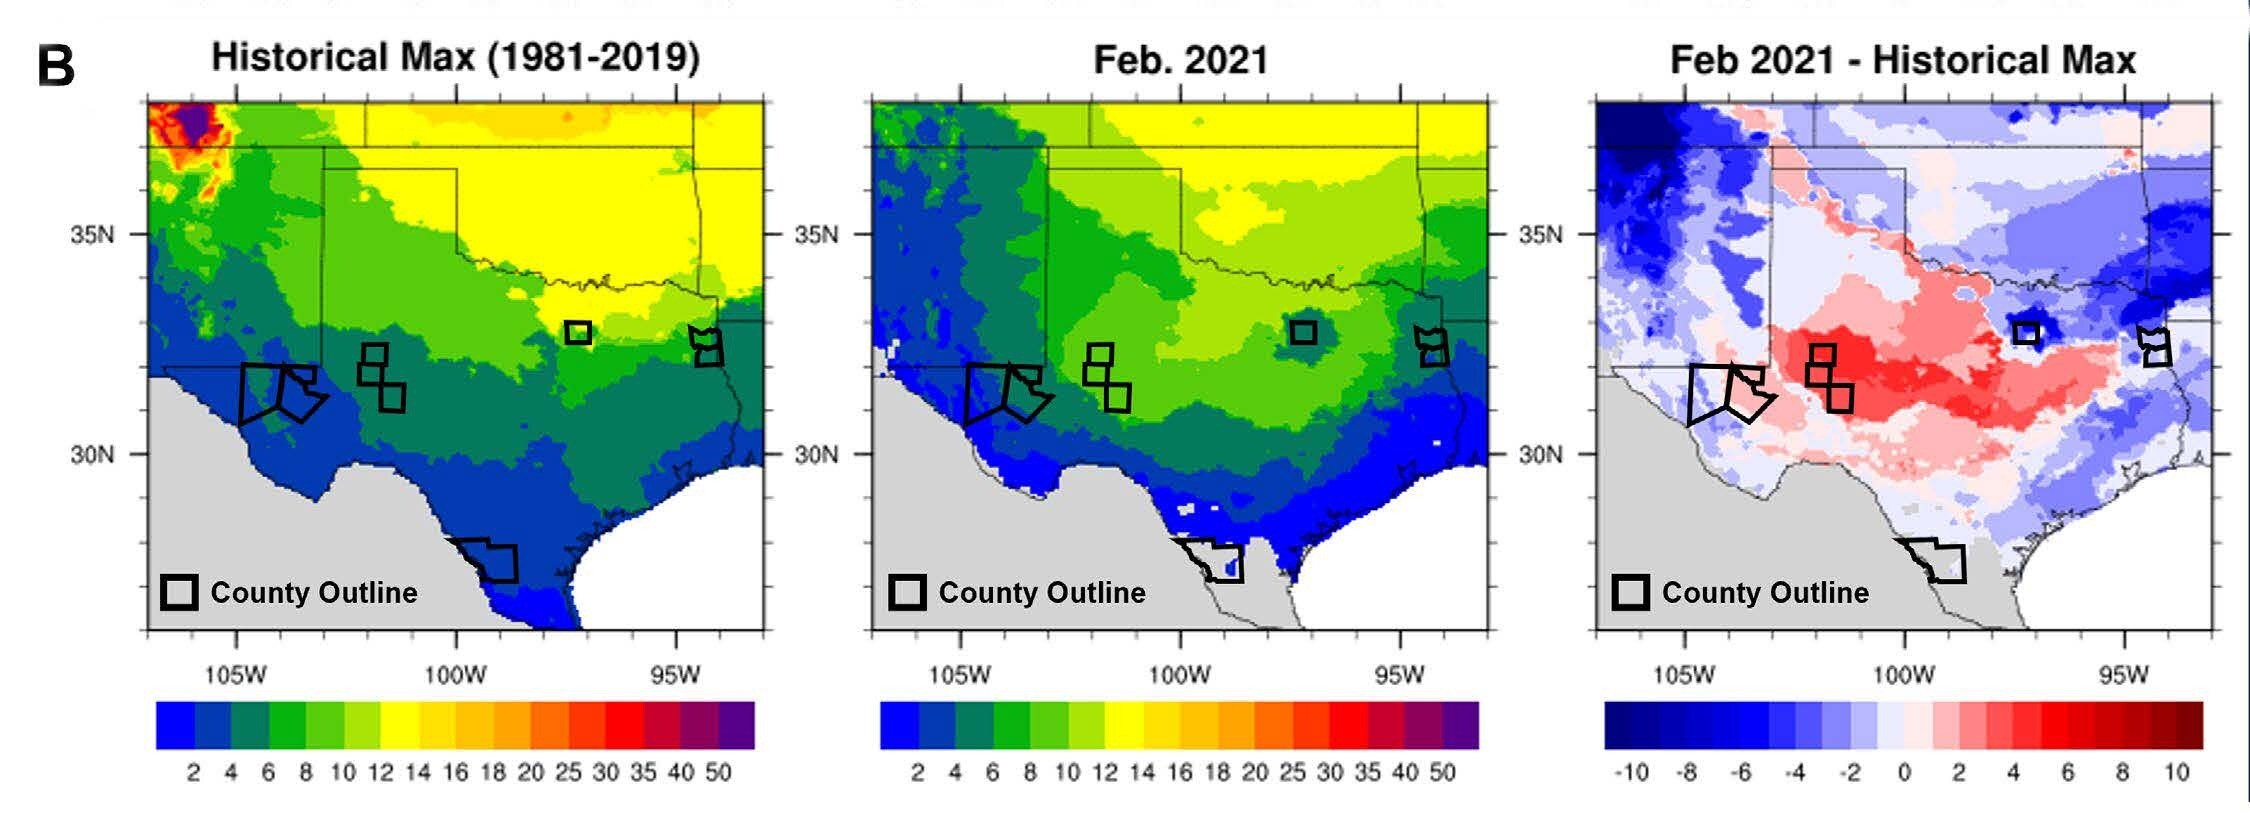 Figure 1B – Duration of consecutive days below freezing (≤32°F) for the Historical Record (left) and the February 2021 event (middle). Difference (in days) between the February 2021 Event and the Historical Record (right) indicates regions where the 2021 event exceeded the maximum duration of consecutive days below freezing (red shading). Maps sourced from Air Worldwide (2021) Article by Marc Marcella3).
The Western Counties of Loving, Midland, Martin, Reagan, and Reeves endured ~2–4 consecutive days below freezing (red shading, right-most map) which is unmatched for this region (Figure 1B).
Each of the top ten natural gas-producing counties experienced a decrease in cumulative natural gas production from January to February and a rebound in production from February to March (Figure 2). Overall, the Western Counties had higher rates of natural gas production decreases (33%–23%) compared to the Eastern Counties (17%–14%). Midland and Martin Counties in West Texas had the most dramatic decline in production and sustained ~4 consecutive days below freezing. On the eastern side of the state, Harrison County saw the lowest temperature recorded in recent history (-13°F) on February 16th–17th5) and a 15% decline in gas production. Ultimately, Texas had a 16% decrease in overall natural gas production from January to February and experienced a rebound in production the following month (Figure 2C).
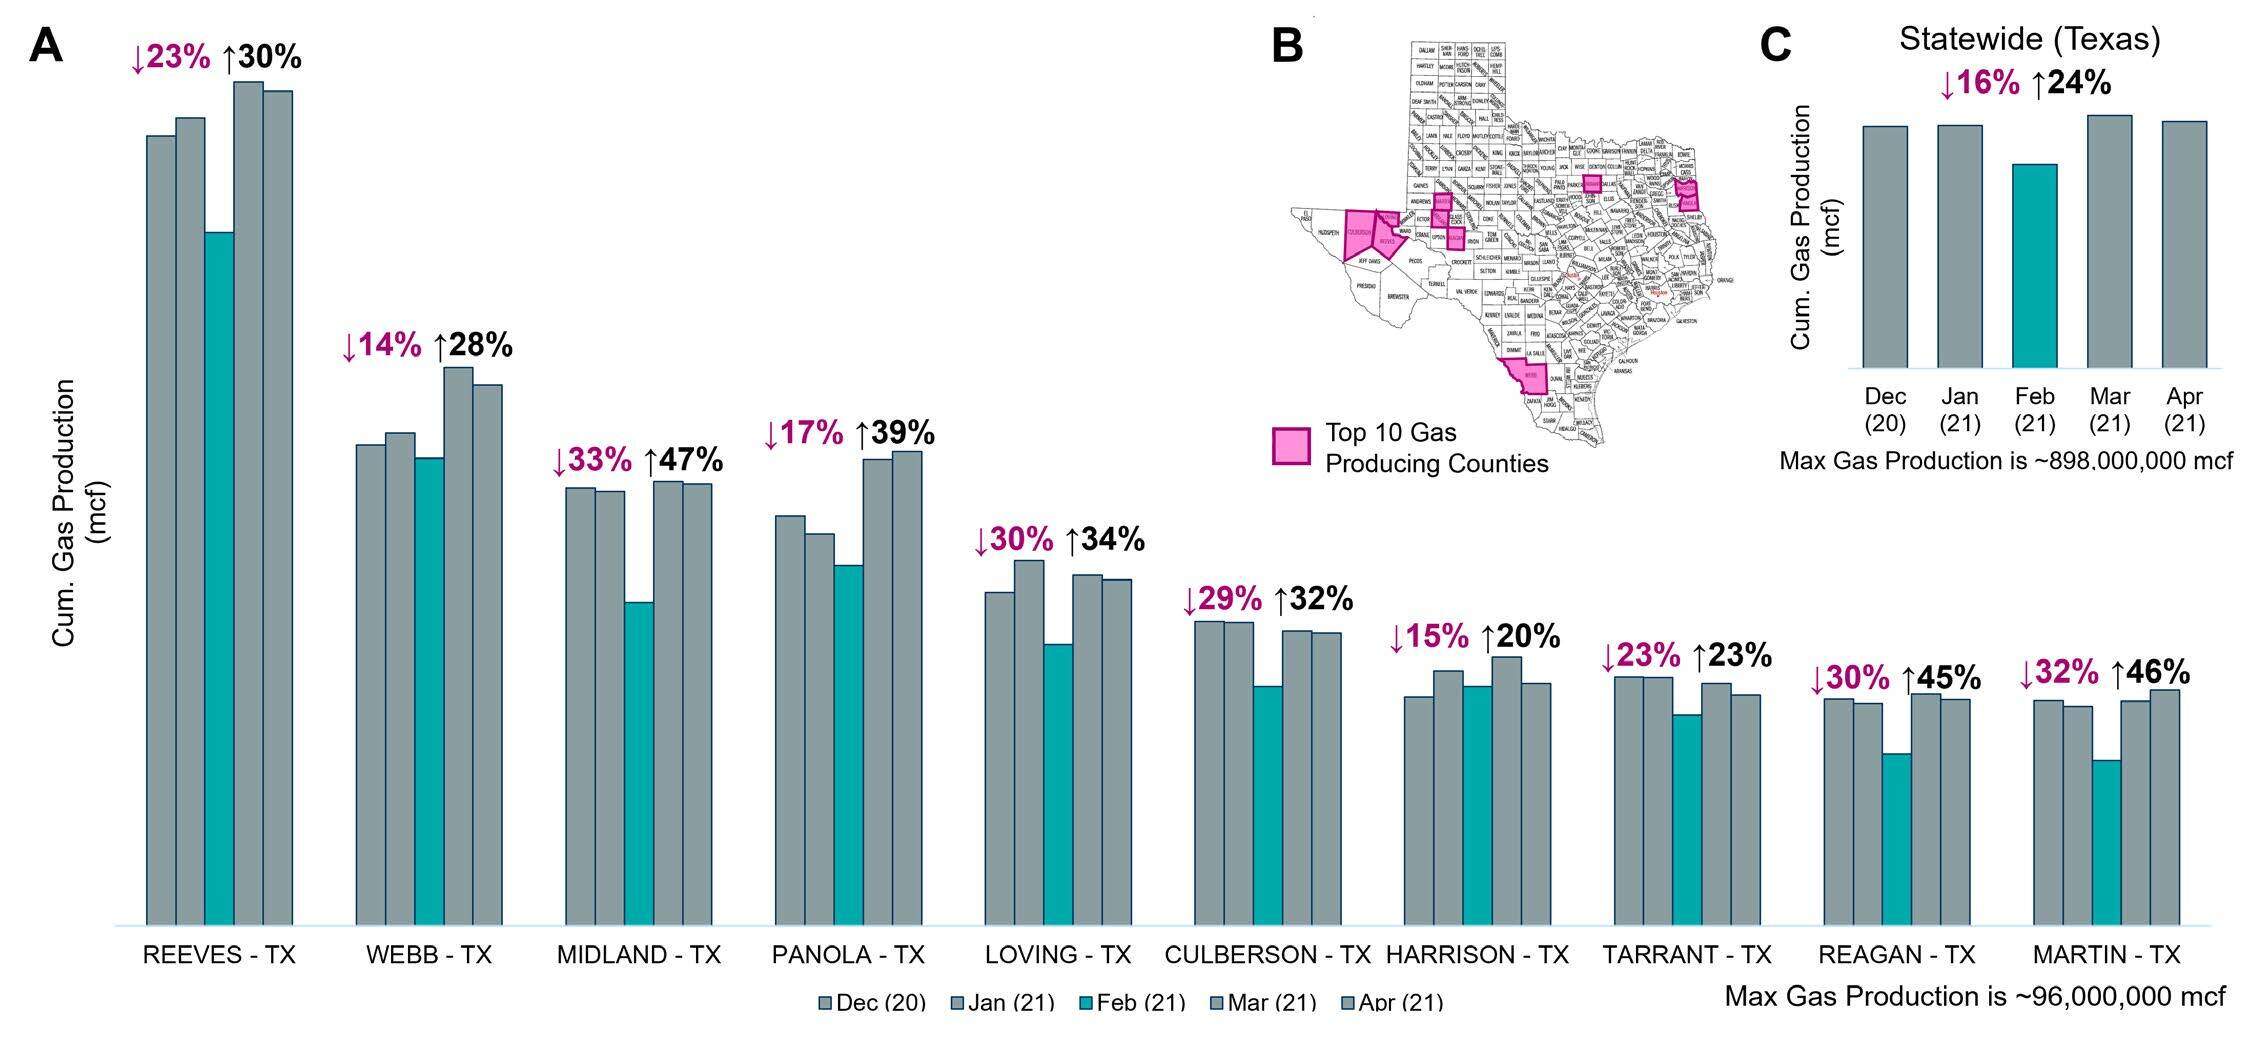 Figure 2A – Monthly cumulative gas production for the top ten gas producing counties in Texas. Production percent changes are from January to February (left) and February to March (right). Figure 2B – The top ten gas producing counties in Texas. Modified from the Sherriff’s Association of Texas (2022)4). Figure 2C – Statewide cumulative gas production with monthly percent changes.
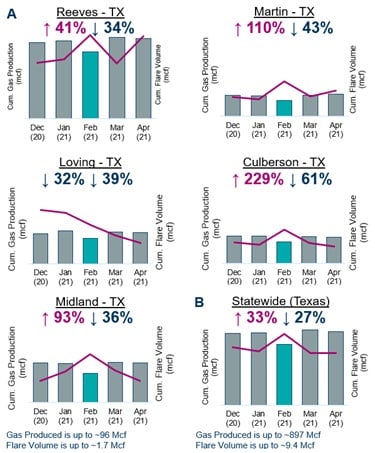
In addition to a decrease in cumulative natural gas production at the county and state level, Texas operators also had an increase in cumulative natural gas flare volume during the event (Figure 3). Out of the top ten natural gas-producing counties, Culberson County had the largest increase in flare volumes (229%) in February. Across the board, Texas had a 33% increase in natural gas flare volumes from January to February (Figure 3B).
Figure 3A – Monthly gas production and flare volumes by county. Flare volume percent changes are from January to February (left) and February to March (right). Figure 3B – Statewide gas production and flare volume percent change.
A statewide decrease in natural gas production had dangerous implications for Texas’ main power grid, ERCOT. The cumulative effects of decreased natural gas supply, paired with surging consumer demand, led to rationing power to Texas homes. Figure 4 shows the electric power demand in megawatt-hours for January, February, and March 2021. Demand for natural gas in the winter months (December–February) is typically the highest6). Still, in February 2021, ERCOT experienced the highest demand for natural gas electric power in recent history6), ~66 million MWh on February 14th (Figure 4).
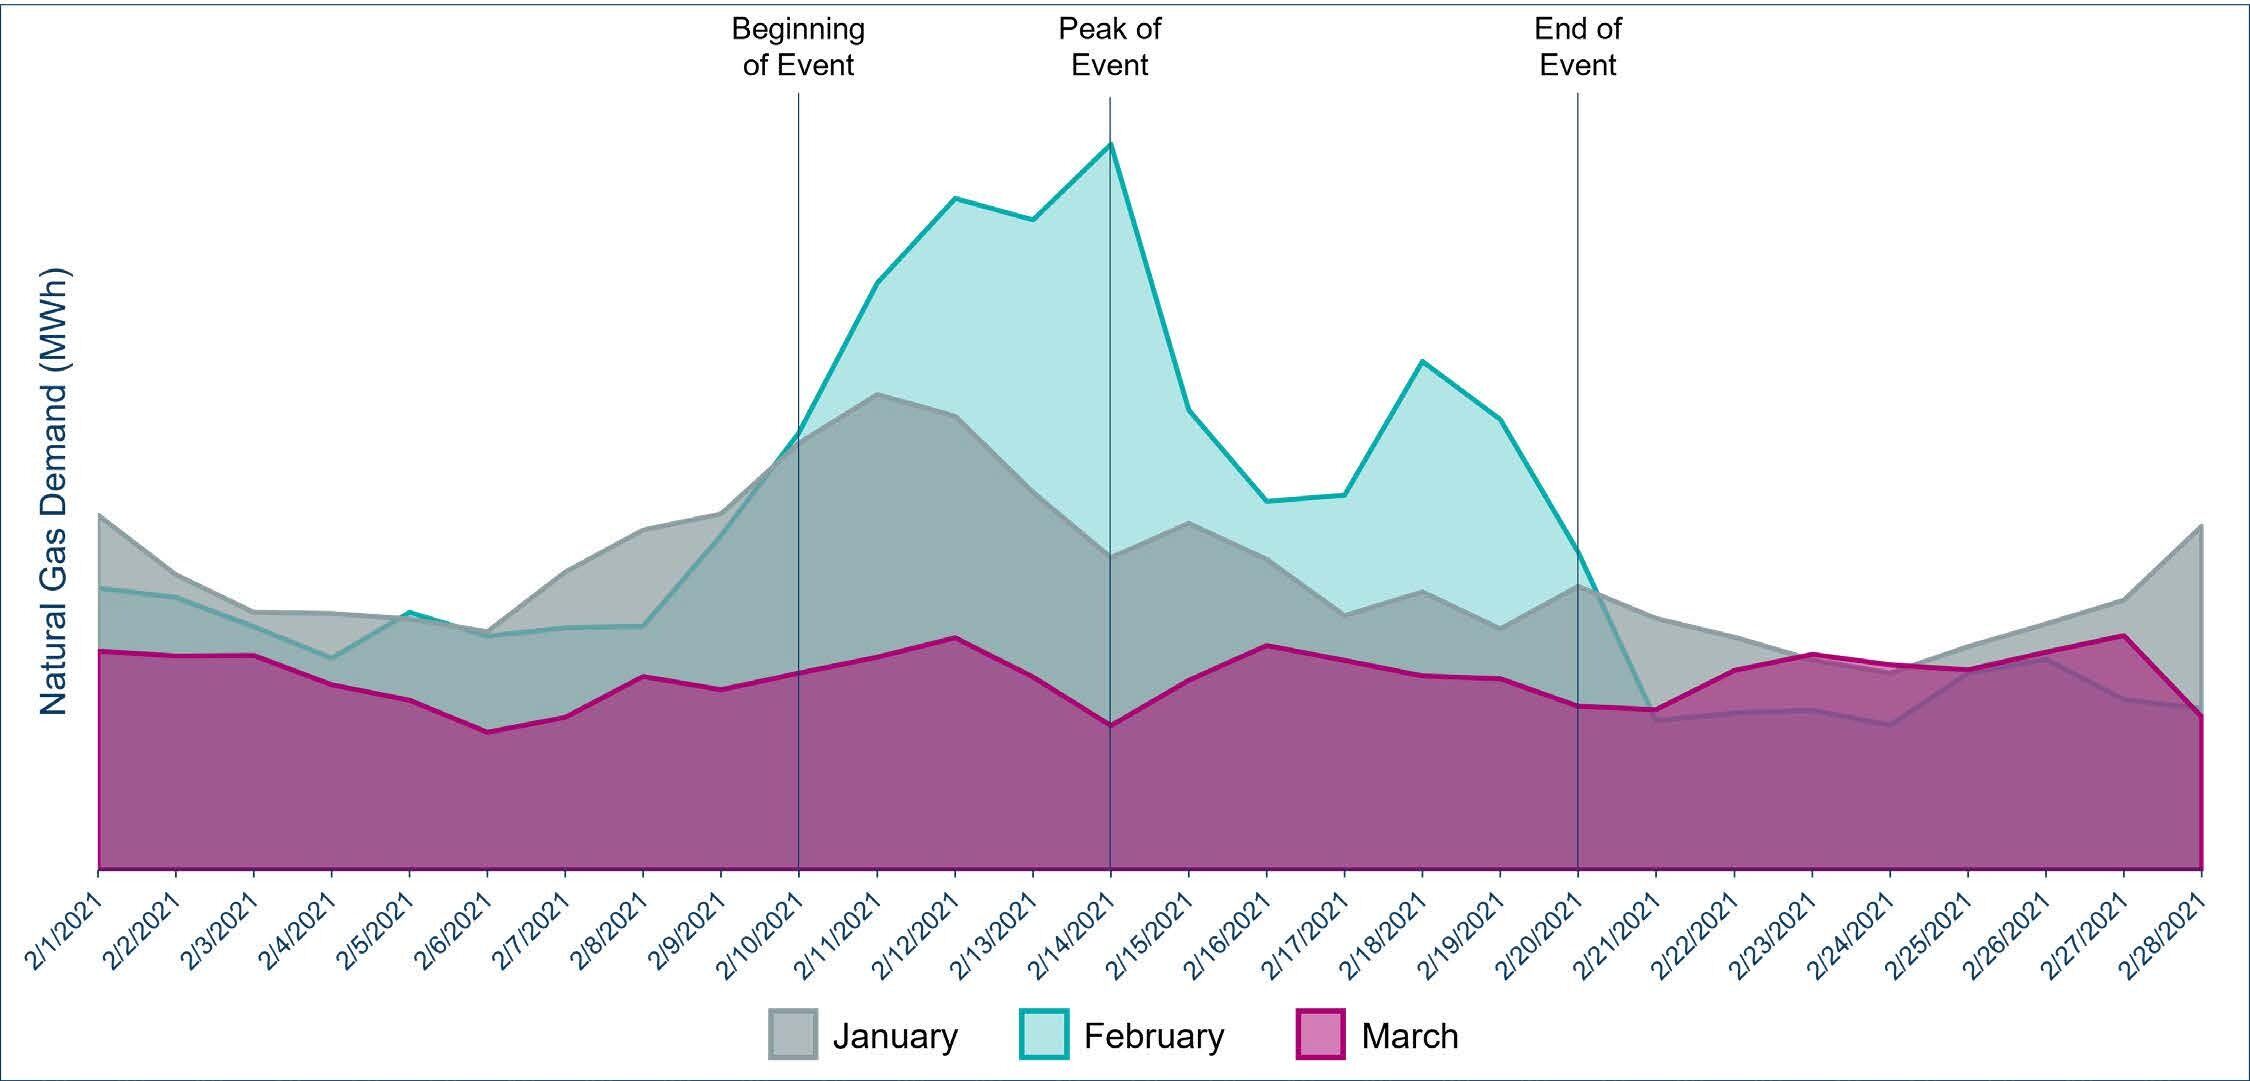 Figure 4 – Texas natural gas demand in megawatt-hours (MWh) for January, February, and March 2021. The February peak represents ~2.8 million MWh in demand. Data sourced from public data archives provided by ERCOT.
Midday on February 14th, 2021, ERCOT started rationing power when the Texas energy grid had to shed electrical load for three days to avoid damages to the grid6,9). The decrease in natural gas production across the state is equivalent to ~58.5 million MWh in electric energy lost during the storm. If this loss were distributed over the five worst days of the event, the energy loss from production shortfalls would have been more than enough to keep electricity and heat supplied to nearly all Texas homes. However, our underlying assumptions do not take into account the natural gas supply and demand for industrial and commercial usage. The increased flared gas volume alone would have been enough to power about 60,000 homes across the state. Figure 5 summarizes the monetary and electric energy losses the gas industry and state faced due to Winter Storm Uri.
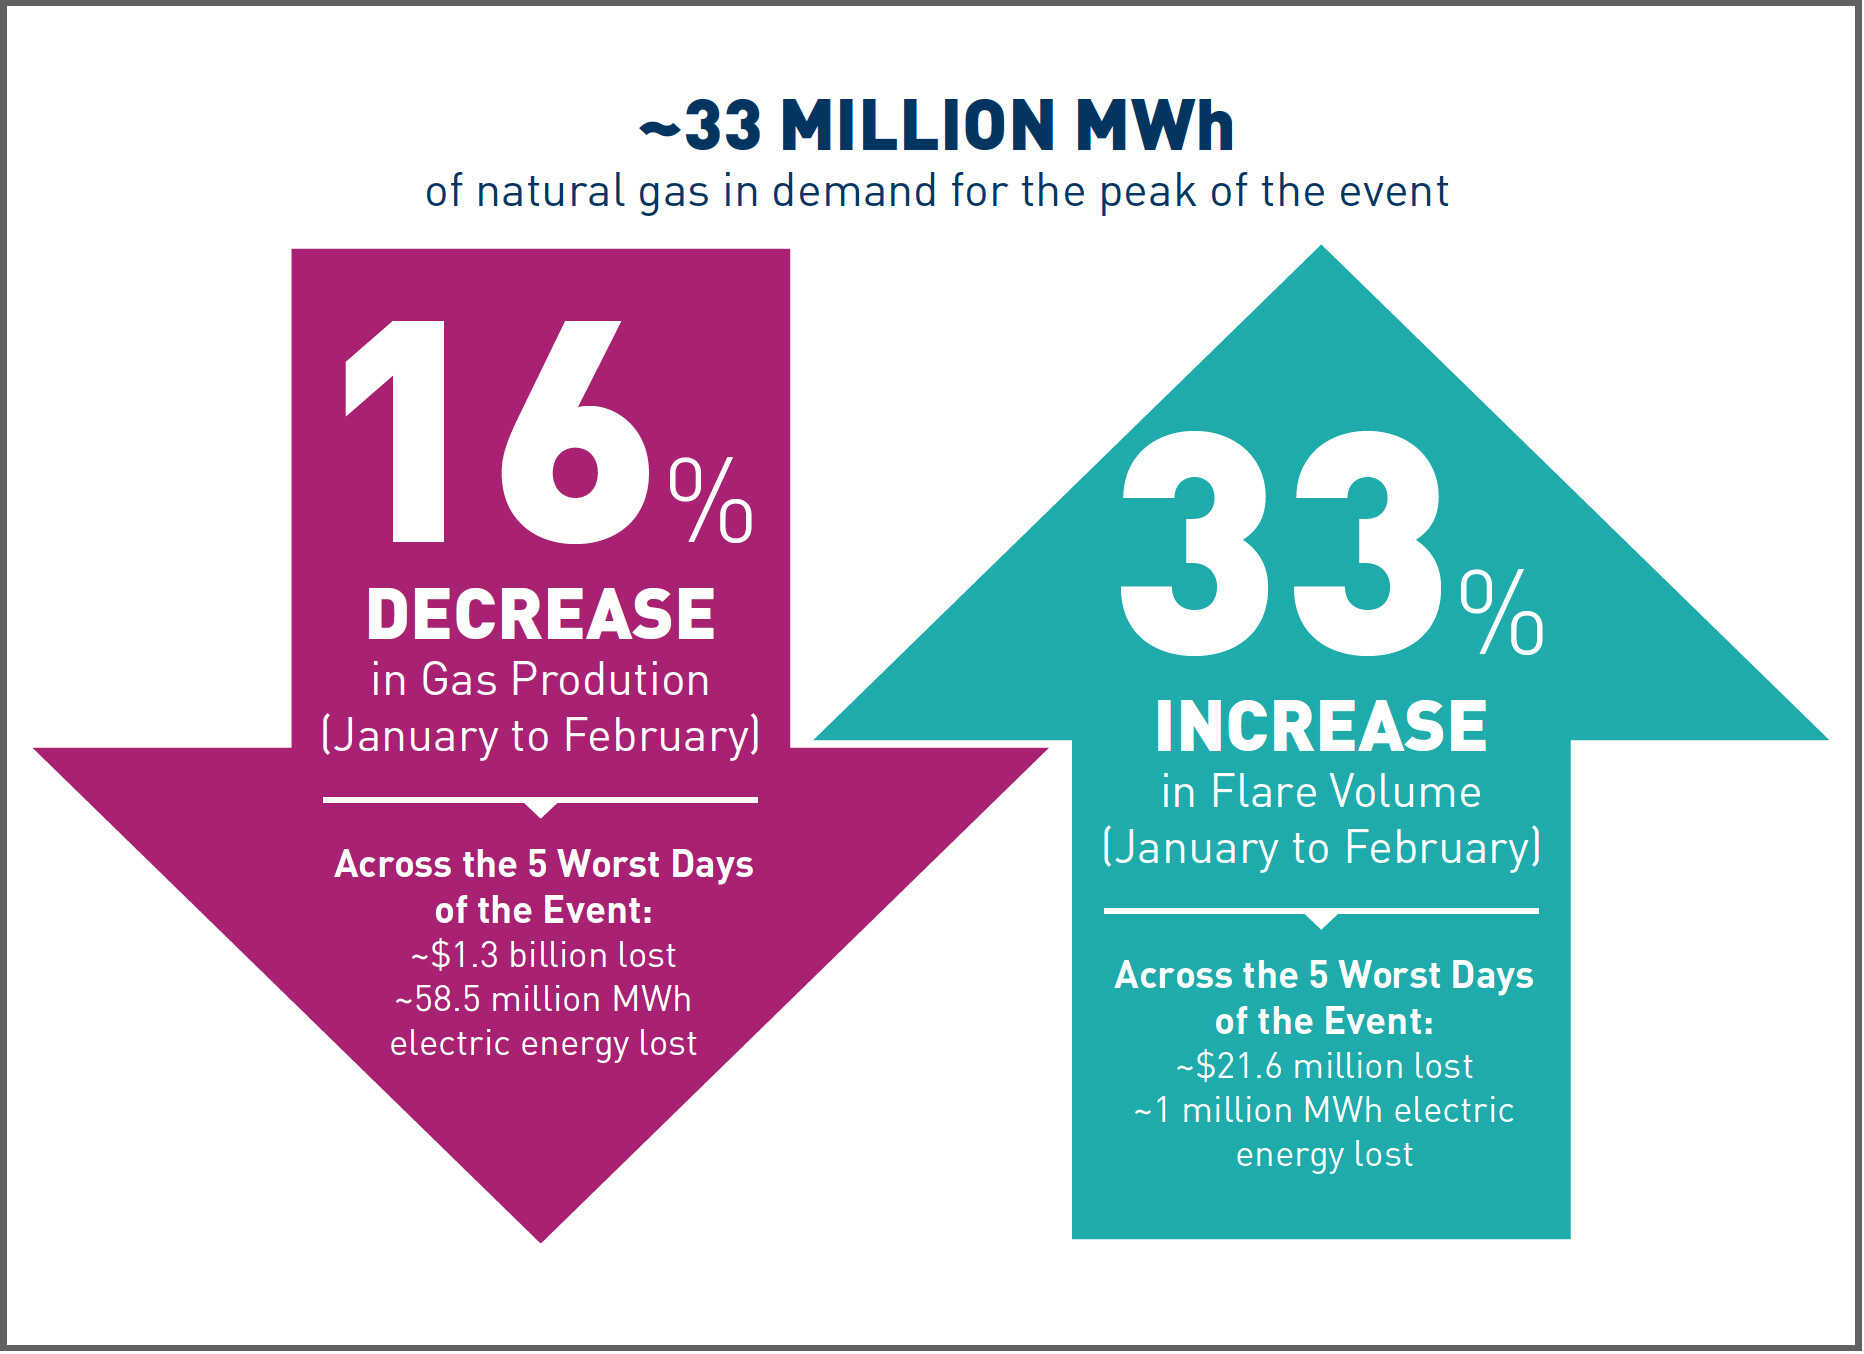 Figure 5 – Summary of impacts during Winter Storm Uri.
Some of the events may have been avoided with proper weatherization of wellheads and gas processing plants, but that comes at a price9). The cost to winterize individual wellheads during drilling and completion is more cost-effective than retrofitting existing wells ($2,800 compared to $50,0007,8,9,10). Weatherizing only wells drilled after January 2019, which accounted for 32% of all natural gas production at the time, would have cost operators as little as $10 million. This seems like a good investment compared to a potential return of $415 million. Texas could also prepare their 176 gas processing plants2) for winter weather, costing anywhere between $60,000 and $600,0007) per plant. To weatherize all gas processing plants in Texas could cost up to $106 million.
Using the TGS Well Performance Dataset, we conclude that Winter Storm Uri caused significant decreases in natural gas production across the state of Texas. Simultaneously, Texas producers disposed of large amounts of gas due to flaring at the wellheads. Ultimately, this cost Texas consumers ~58.5 million MWh in electric energy and operators up to $1.3 billion in revenue over five days when the winter weather was at its worst. Findings from our work suggest that it would be cost-effective to invest in weatherization for wellheads during drilling and completion to mitigate such damages in the future and save operators millions in revenue.
References:
1) King, C. W., Rhodes, J. D., Zarnikau, J., Lin, N., Kutanoglu, E., Leibowicz, B., & Austgen, B. (2021). The timeline and events of the February 2021 Texas electric grid blackouts. The University of Texas Energy Institute
2) U.S. Energy Information Administration
3) Air Worldwide (2021) Article by Marc Marcella
4) Sherriff’s Association of Texas (2022)
5) National Centers for Environmental Information, National Oceanic and Atmospheric Administration
6) Electric Reliability Council of Texas, Inc.
7) KCEN – Texas News Article “Weatherizing the Texas power grid: How much will it cost?”
8) The Texas Tribune Article “Gov. Greg Abbott wants power companies to “winterize.” Texas’ track record won’t make that easy
9) Federal Energy Regulatory Commission and the North American Electric Reliability Corporation - Regional Entity Staff Report (November 2021), “The February 2021 Cold Weather Outages in Texas and the South Central United States”
10) Federal Energy Regulatory Commission and the North American Electric Reliability Corporation (August 2011), “Report on Outages and Curtailments During the Southwest Cold Weather Event of February 1-5, 2011 – Causes and Recommendations”
11) 2022 IamExpat Media B.V.