
First Published: The Leading Edge, June 2021 (https://doi.org/10.1190/tle40060454.1)
Practical application of global siliciclastic rock-property trends to AVA interpretation in frontier basins
Global empirical relationships of P-wave to S-wave and density for sandstones and shales are used to model two-term amplitude variation with angle at various depths of burial in a typically compacting siliciclastic basin. Data from the normally pressured Tertiary strata of Judd Basin, Atlantic Margin, West of Shetland, are used as a control. For a typical prospect depth of 1750 m below mudline, forward models of angle-dependent reflectivity reveal that discrimination of lithology (shale and brine sand) and fluid (oil sand) is optimally resolved at a 47° incidence angle (θ). This is equivalent to an angle of 28° on an intercept-gradient crossplot. Repeat experiments at other depths produce similar results but with the angle for optimal lithology and fluid determination shifting slightly with increasing depth. Background trends in seismic data crossplots of intercept versus gradient are typically overprinted by noise that has a disproportionate effect on the gradient. This study suggests that the difference between the noise and background rock-property trend is relatively small, such that in most modern seismic data sets, anomalies should be identifiable on time-windowed crossplots and equivalent weighted stacks. It is proposed that a seismic inversion for relative extended elastic impedance at a 45° incidence angle should capture most anomalies of interest in frontier basins with simple burial histories. An example is illustrated from a seismic line in Mozambique.
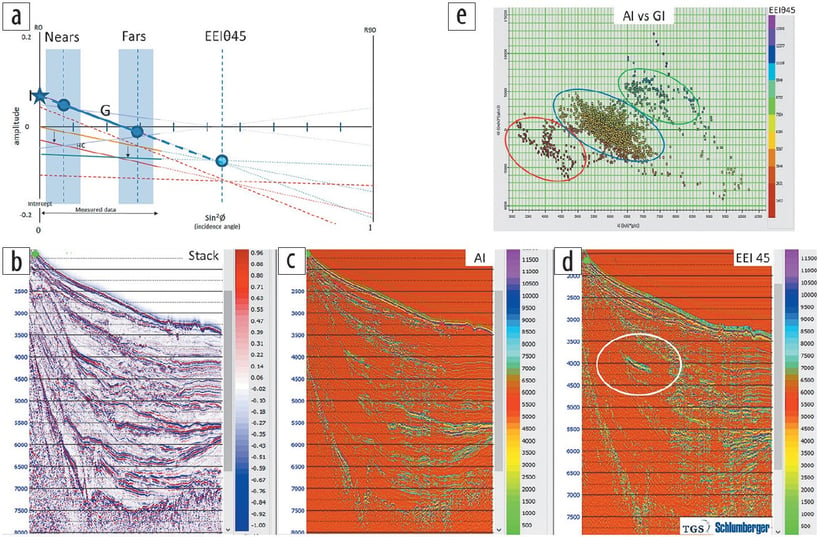
Inversion routine and example result from offshore Mozambique. (a) Inversion routine generating relative AI and EEI(θ)45 from the near- and far-angle stacks. (b) Full stack. (c) Relative AI. (d) Relative EEI(θ)45 highlighting anomaly (circled). (e) AI versus GI crossplot showing the anomaly (circled in red). Note that the color coding of the crossplot is EEI(θ)45, confirming that the attribute EEI(θ)45 is a representation of the AI versus GI crossplot. Data courtesy of TGS and Schlumberger.
Download the full article using the link at the top of this page.