


The Location
Location
Hammerfest Basin, Barents Sea
Survey Year
2018
Survey Type
3D GeoStreamer
Streamer Configuration
uHD3D, 16 x 56.25 m spread, 7 and 10 km streamers
Source Configuration
Triple source
Survey Size
4 172 sq. km

The Challenge

The Solution
Data
High Density GeoStreamer 3D
Ultra Efficient
Improved near offsets
Dense bin size
6.25 m x 9.375 m
Velocity Model Building
FWI using additional long offsets
Increased Model Depth
From 2.5 km to 4 km
Imaging
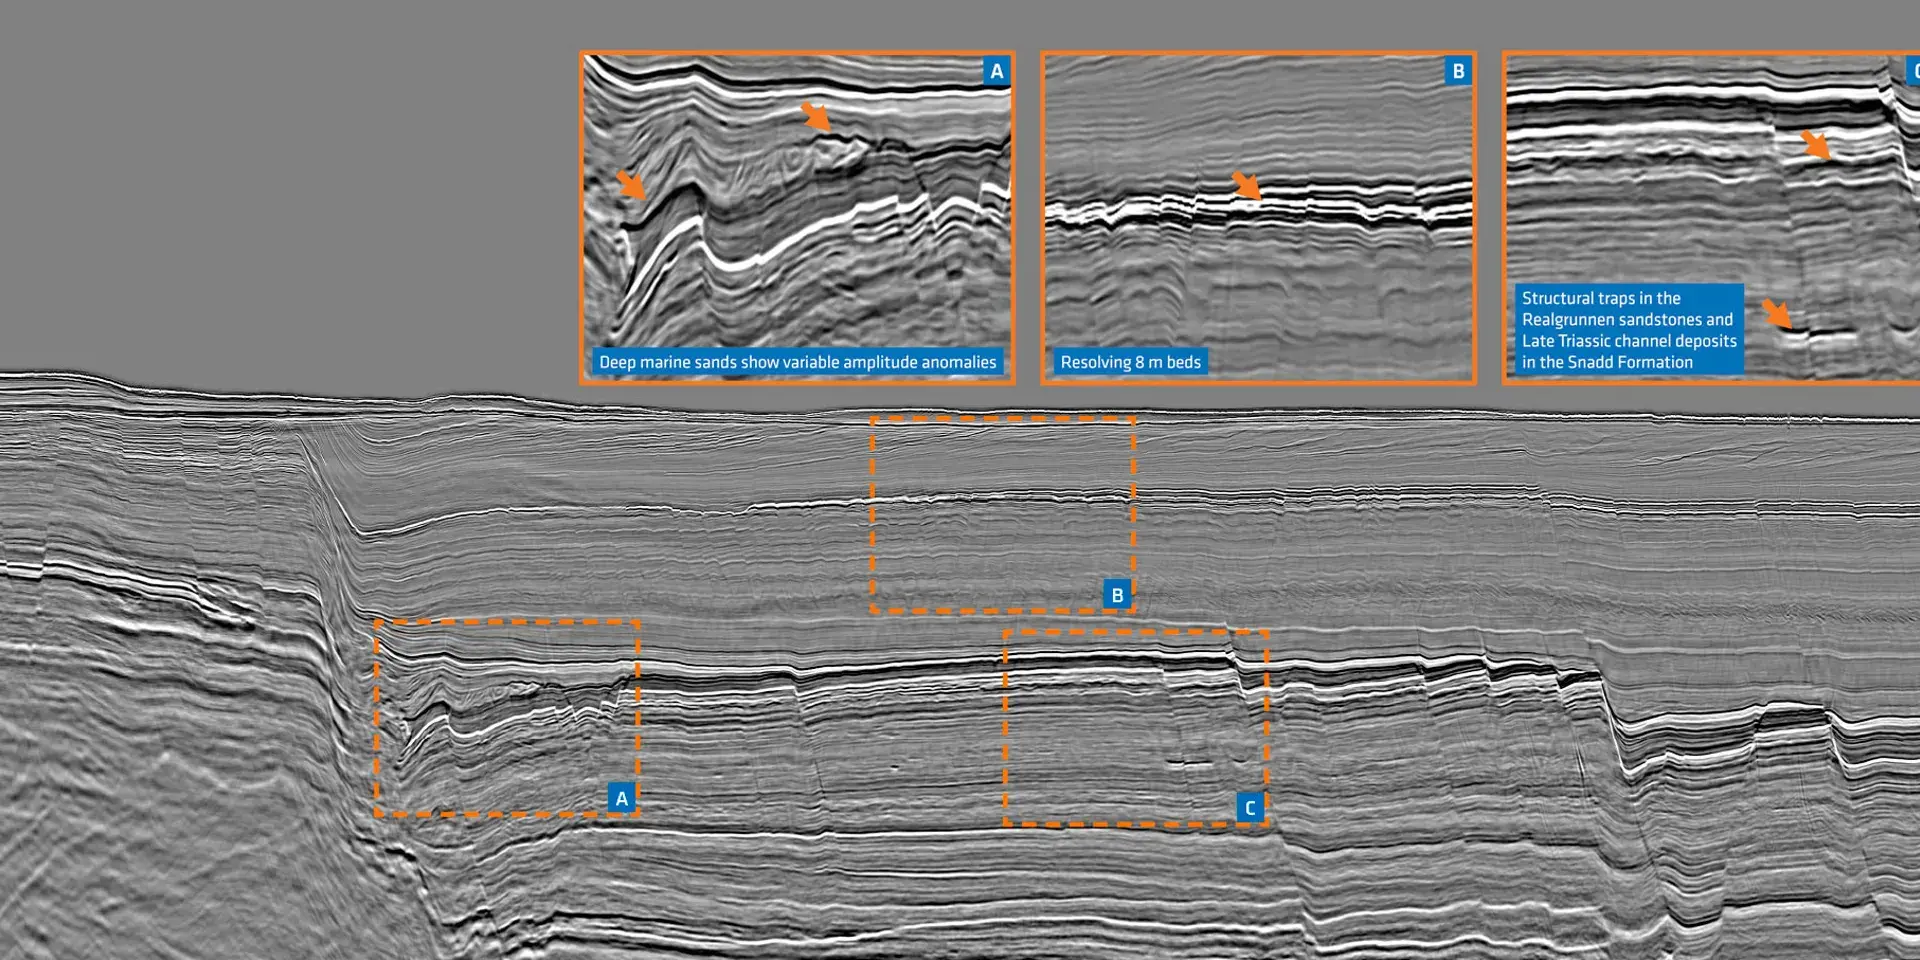
Up to 200 Hz
In 2018 TGS utilized a novel acquisition setup for acquiring an ultra-high-density 3D seismic dataset in the Barents Sea, covering parts of the Hammerfest Basin and Finnmark Platform. In addition to 16 densely spaced streamers, three streamers were extended from 7 km to 10 km length, allowing the recording of deeper diving waves (refractions) and therefore enabling FWI to produce velocity updates to greater depths.
Diving Deeper with FWI from 10 km Streamers

The Results
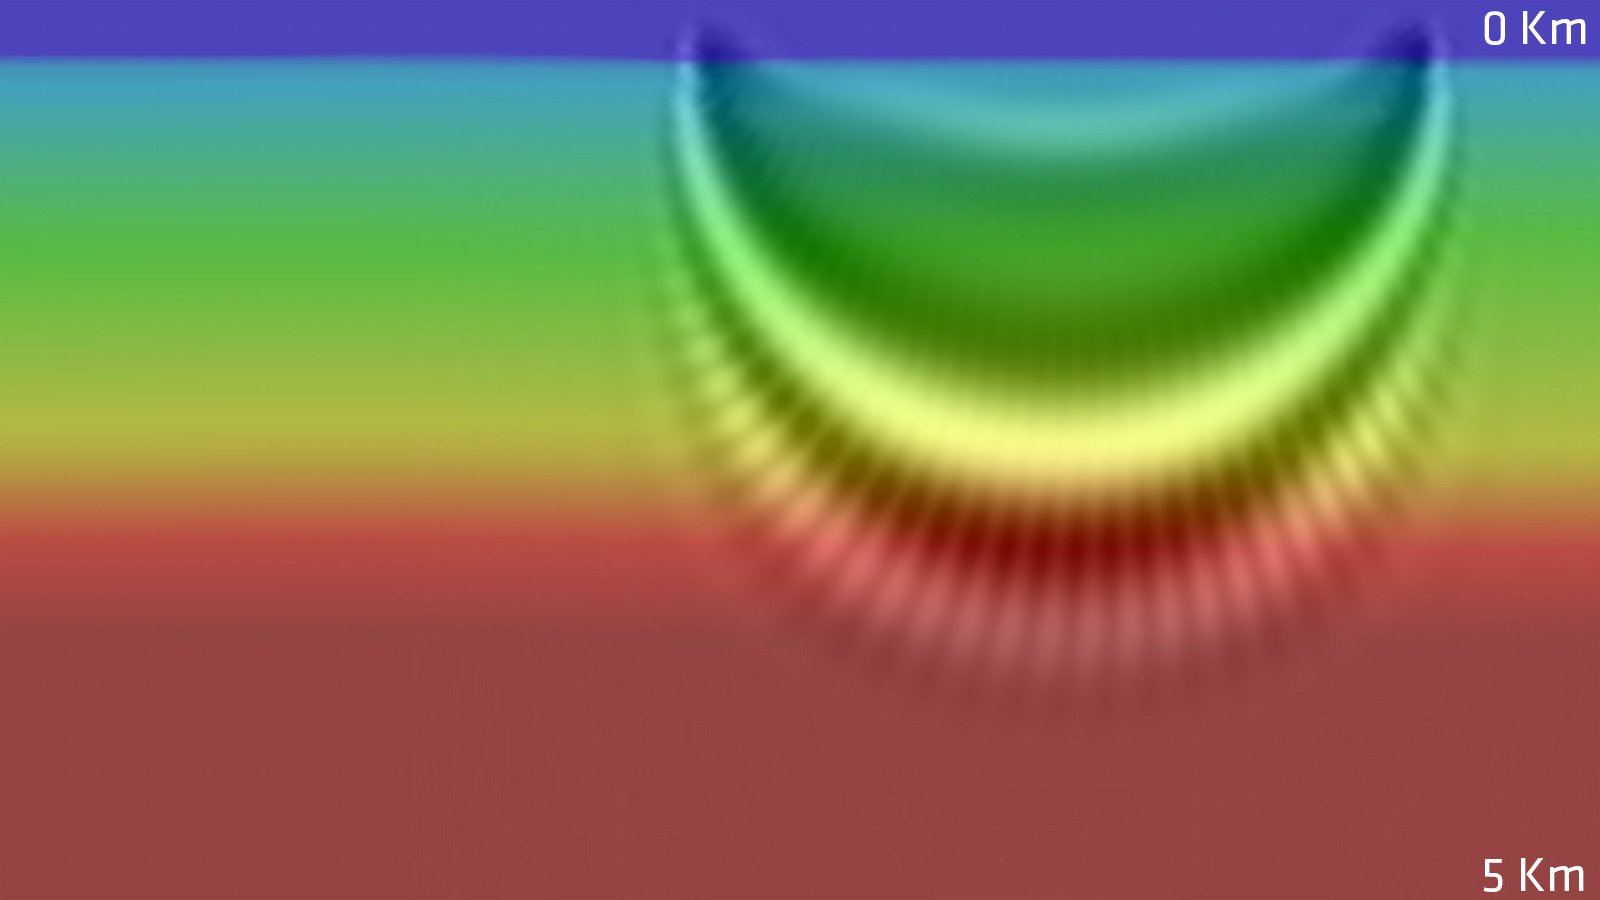
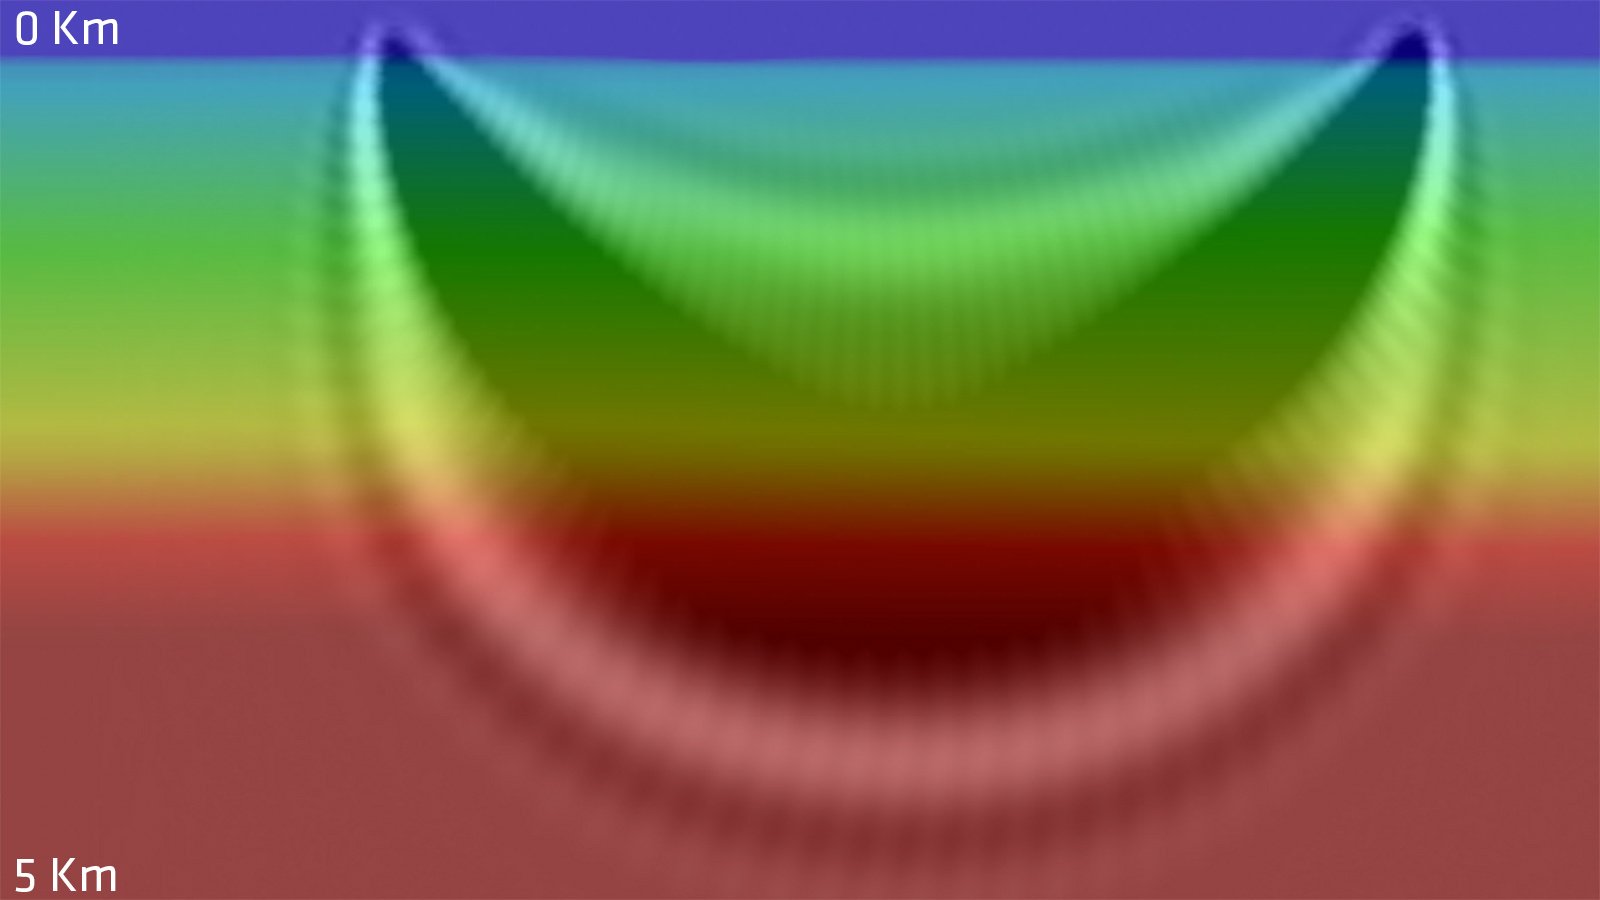
FWI Captures Reservoir and Shallow Gas Cloud Goliat Field
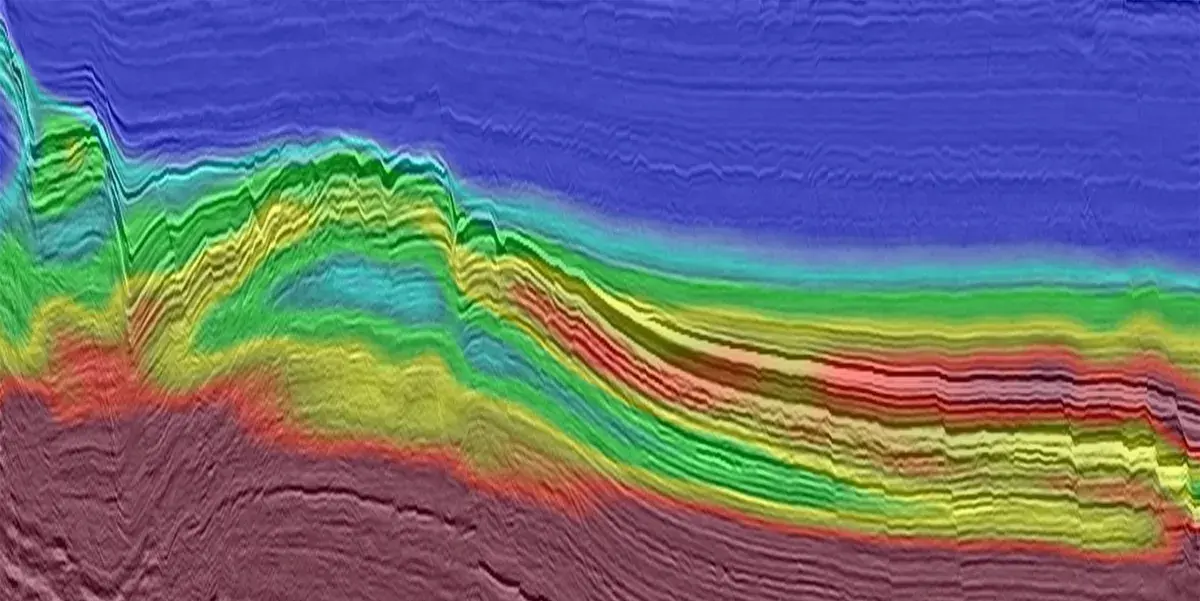
Fast track KPSTM stack with FWI velocity overlay through the Goliat reservoir. At the reservoir level, the model shows a clear low velocity anomaly, potentially indicating a porous and hydrocarbon filled sand body.
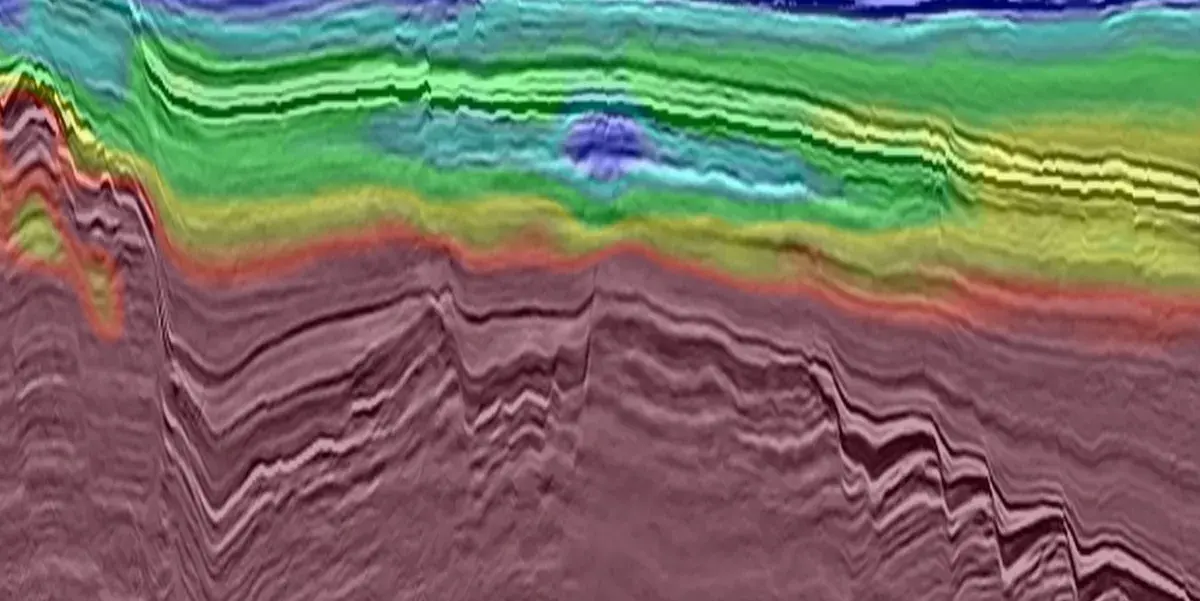
Gas from the reservoir has leaked upwards via a complex series of faults and accumulated higher in the section. FWI resolves this shallow gas cloud effectively highlighting a potential shallow hazard in the area.
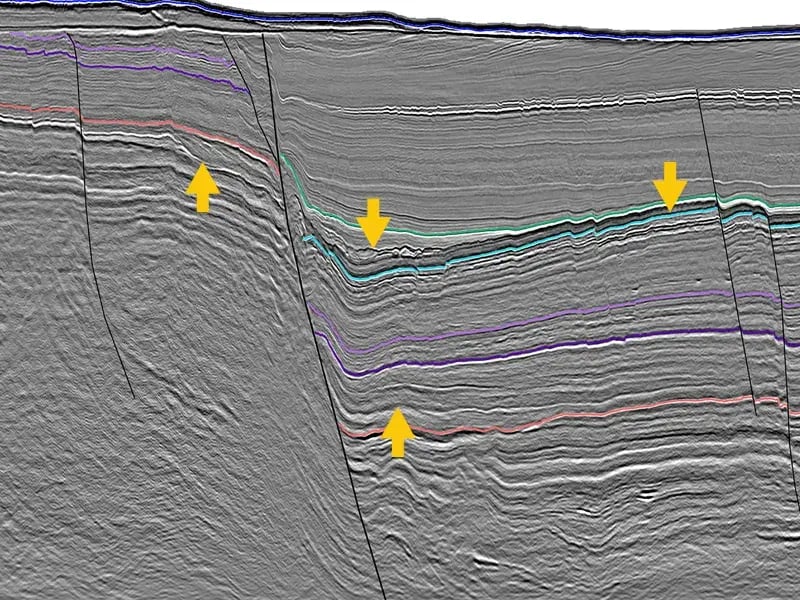
Correlation Between Velocity and Amplitude Indicates Hydrocarbon Accumulations
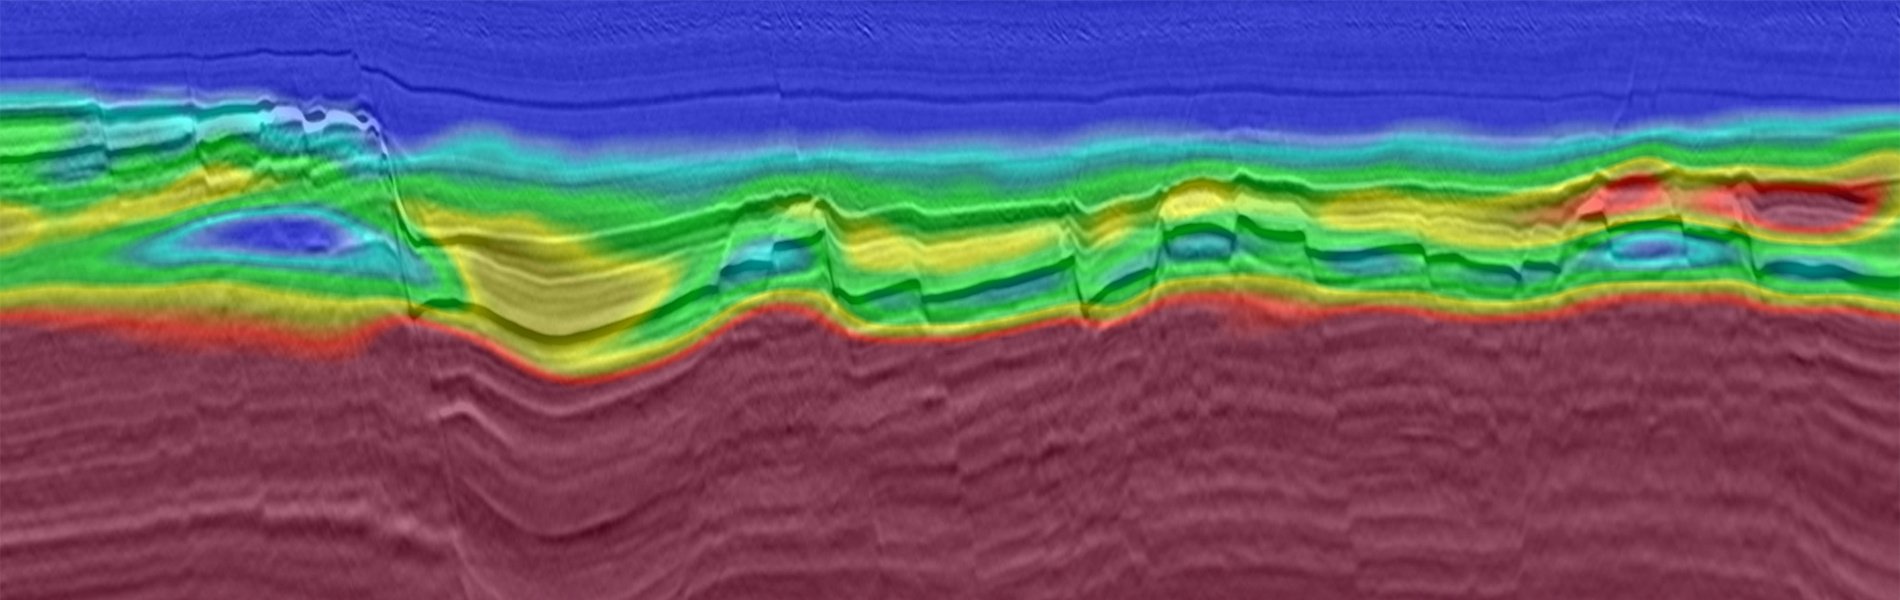
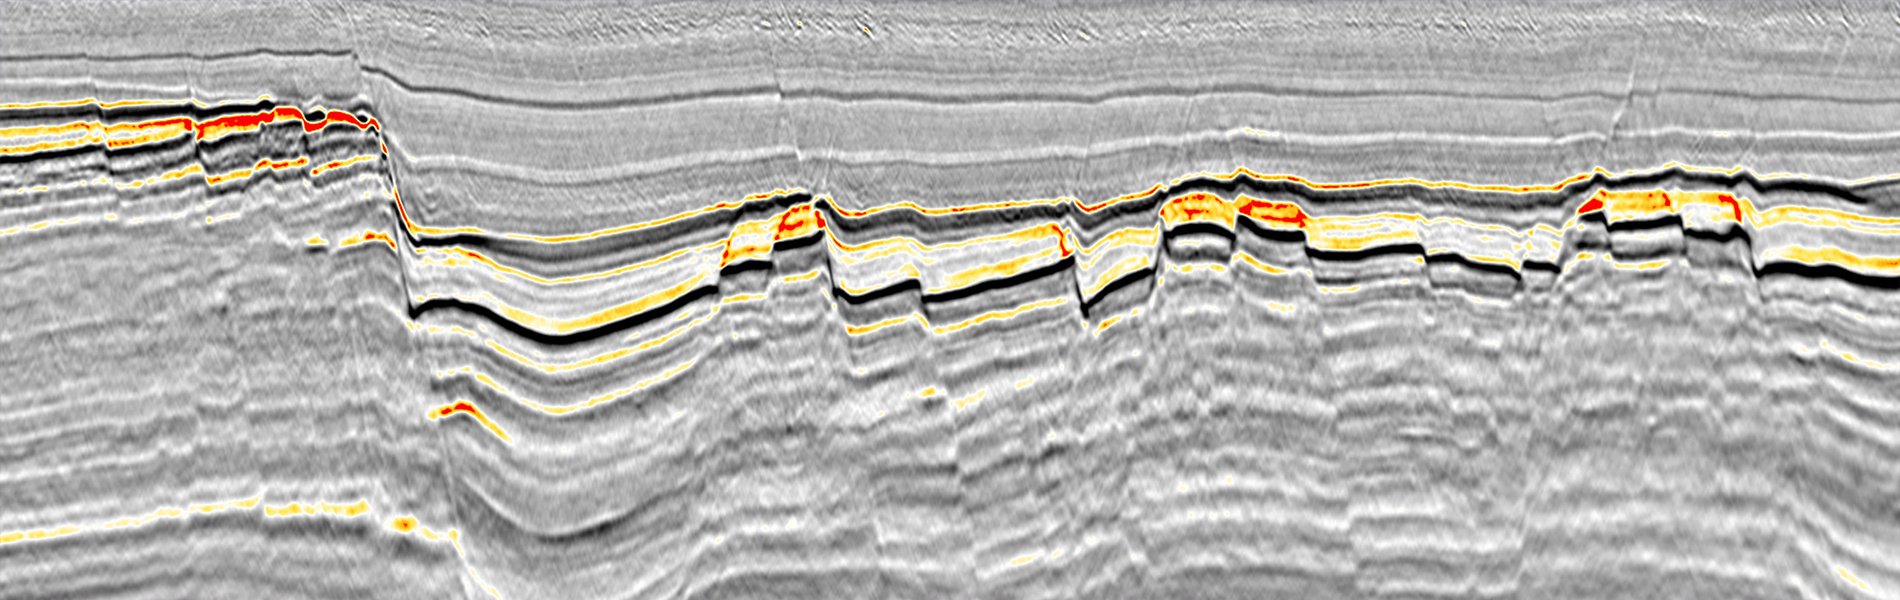
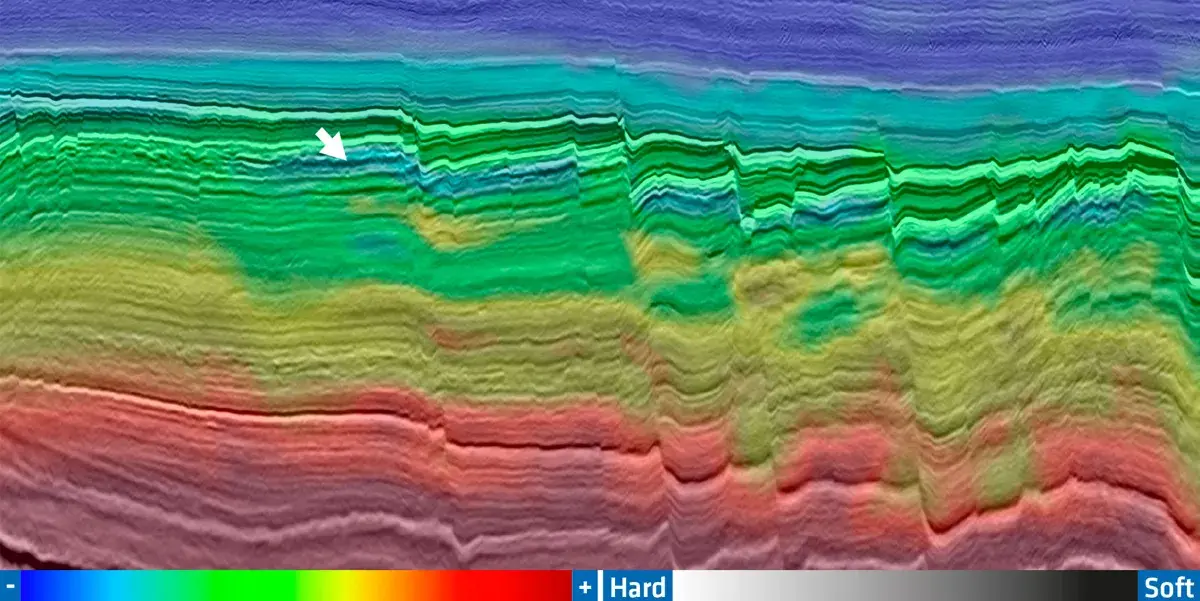
FWI velocity model overlaid on a KPSDM stack. Both amplitude and velocity anomalies correlate well and therefore this can be an indication of hydrocarbon accumulations at the structural highs.