


The Location
Location
Outer Vøring, Norwegian Sea
Survey Year
2016
Survey Type
3D GeoStreamer
Configuration
16 streamers, 75 m separation, 8100 m length
Survey Size
5 500 sq. km
Water depth
800 - 1 600 m
Water depth
25 m

The Challenge

The Solution
Data
Good S/N due to multisensor and deep tow
Processing
4 ms
Signal Processing
Full 3D demultiple
Velocity Model Building
FWI using reflections and refractions
Frequency Range for FWI
2-12 Hz
Q modeling
Variable Q model to capture high-absorption ooze bodies
TGS FWI solution includes reflections and refractions to provide deeper and higher resolution velocity models. Small-scale velocity variations and sharp velocity contrasts between the ooze bodies and surrounding lithology are captured. Q modeling is included to compensate for amplitude distortions and to ensure absorption is incorporated during the migration.
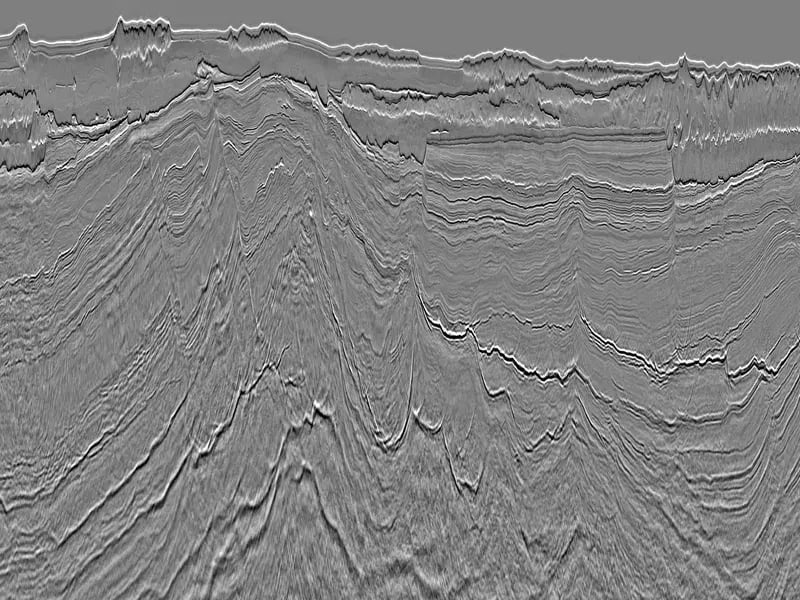
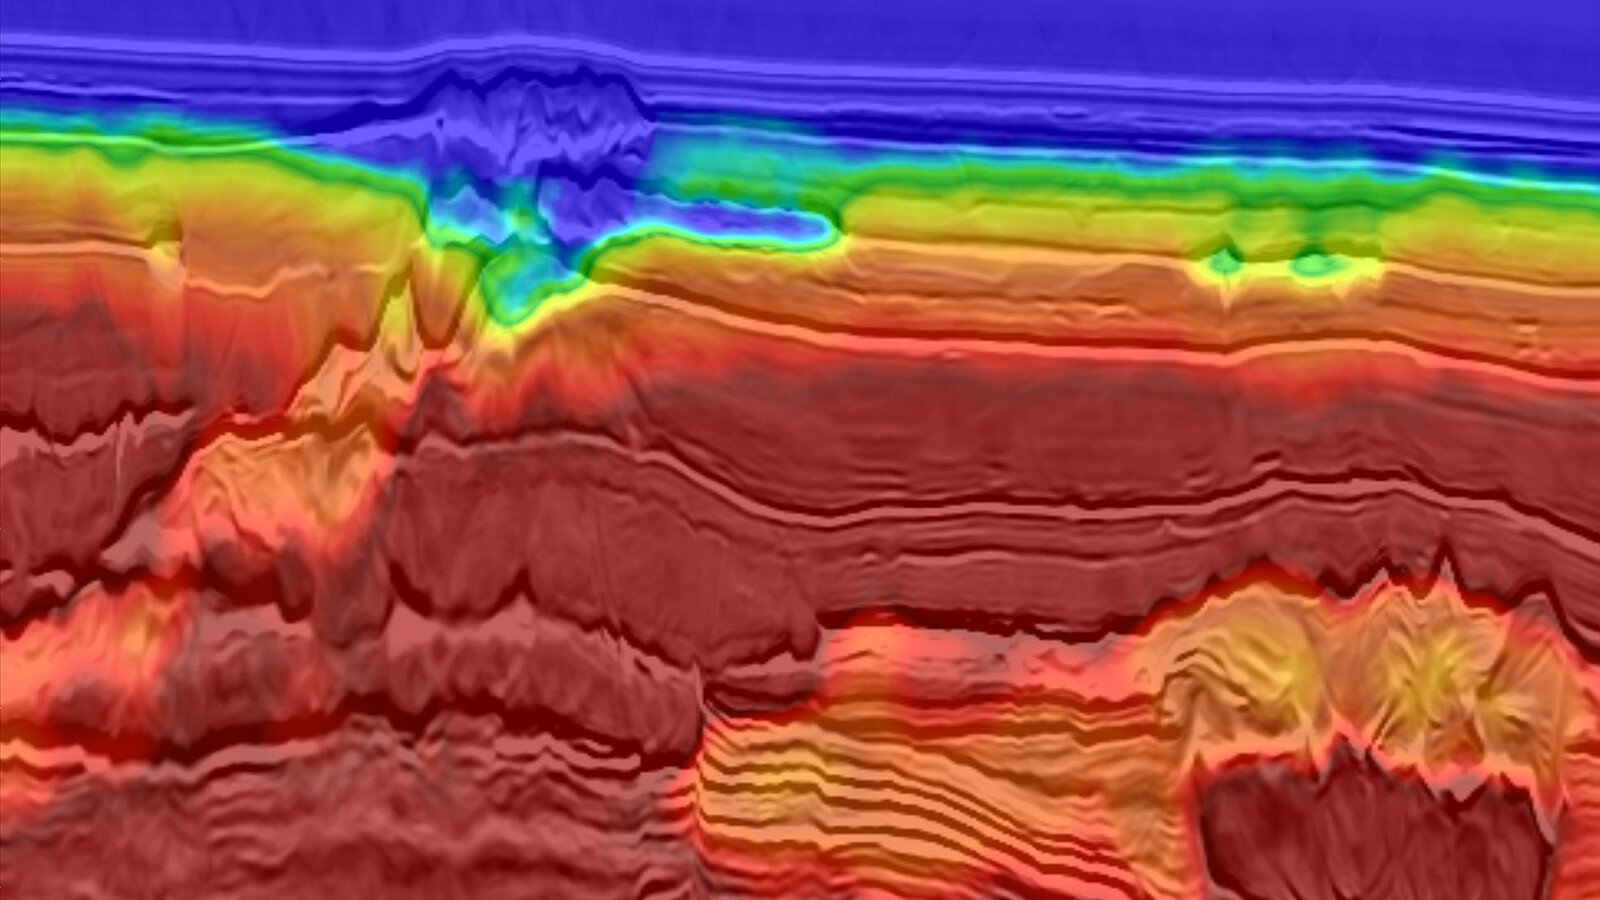
Ooze Bodies Better Resolved with FWI
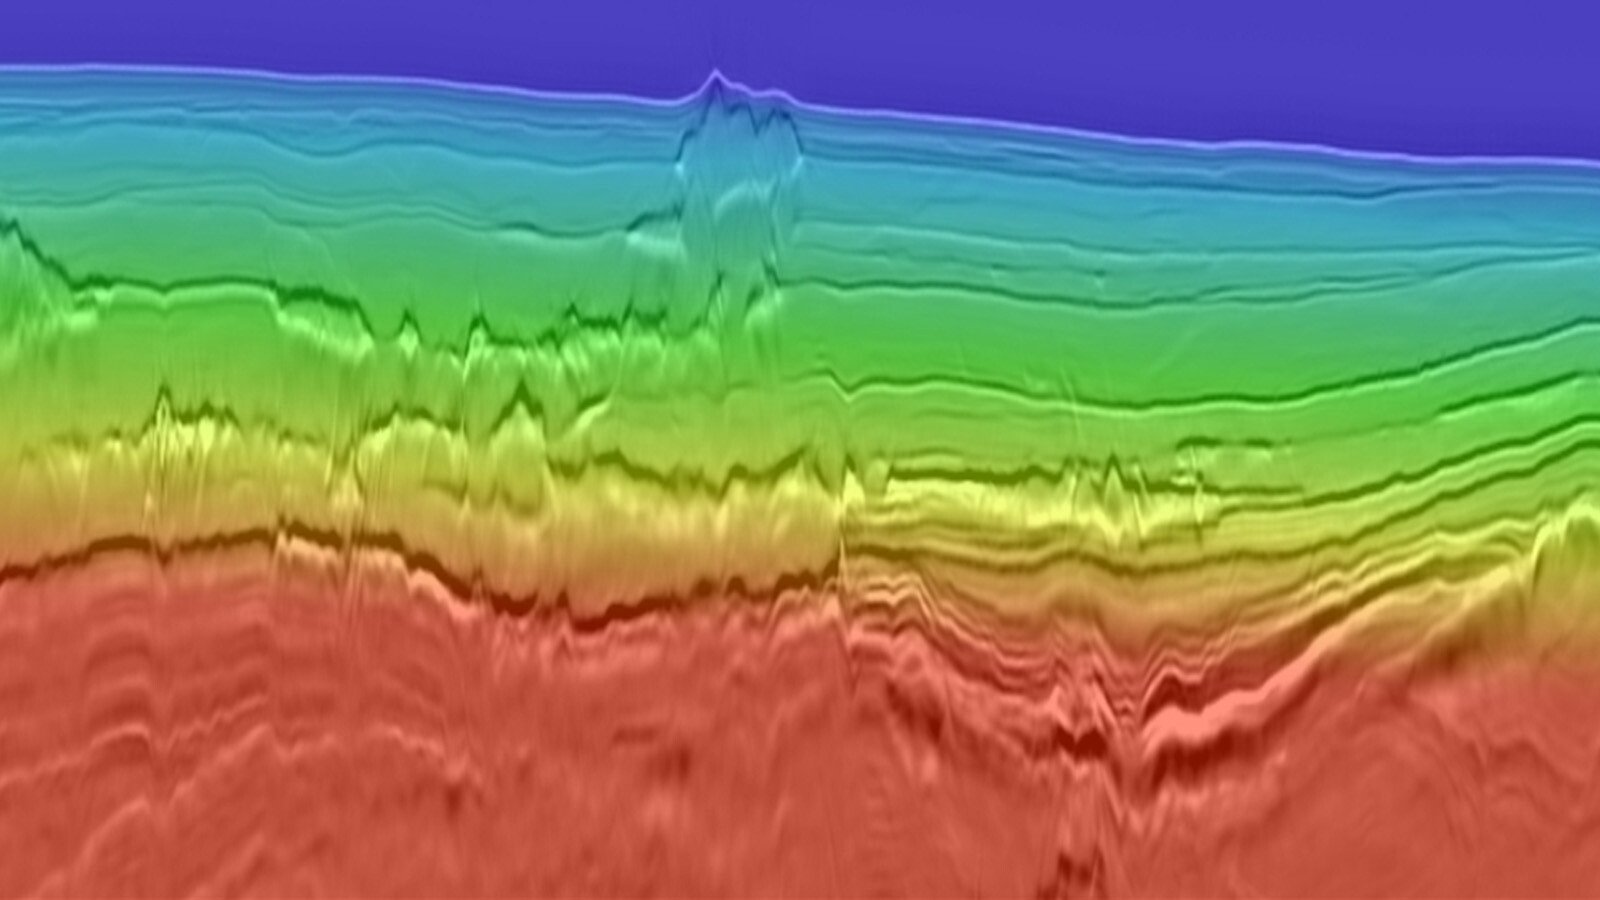
PSDM stack and 1 700 m depth slice for the initial (left) and final FWI velocity model overlays (right). Ooze bodies are much better resolved with reflections and refractions in TGS FWI.

The Results
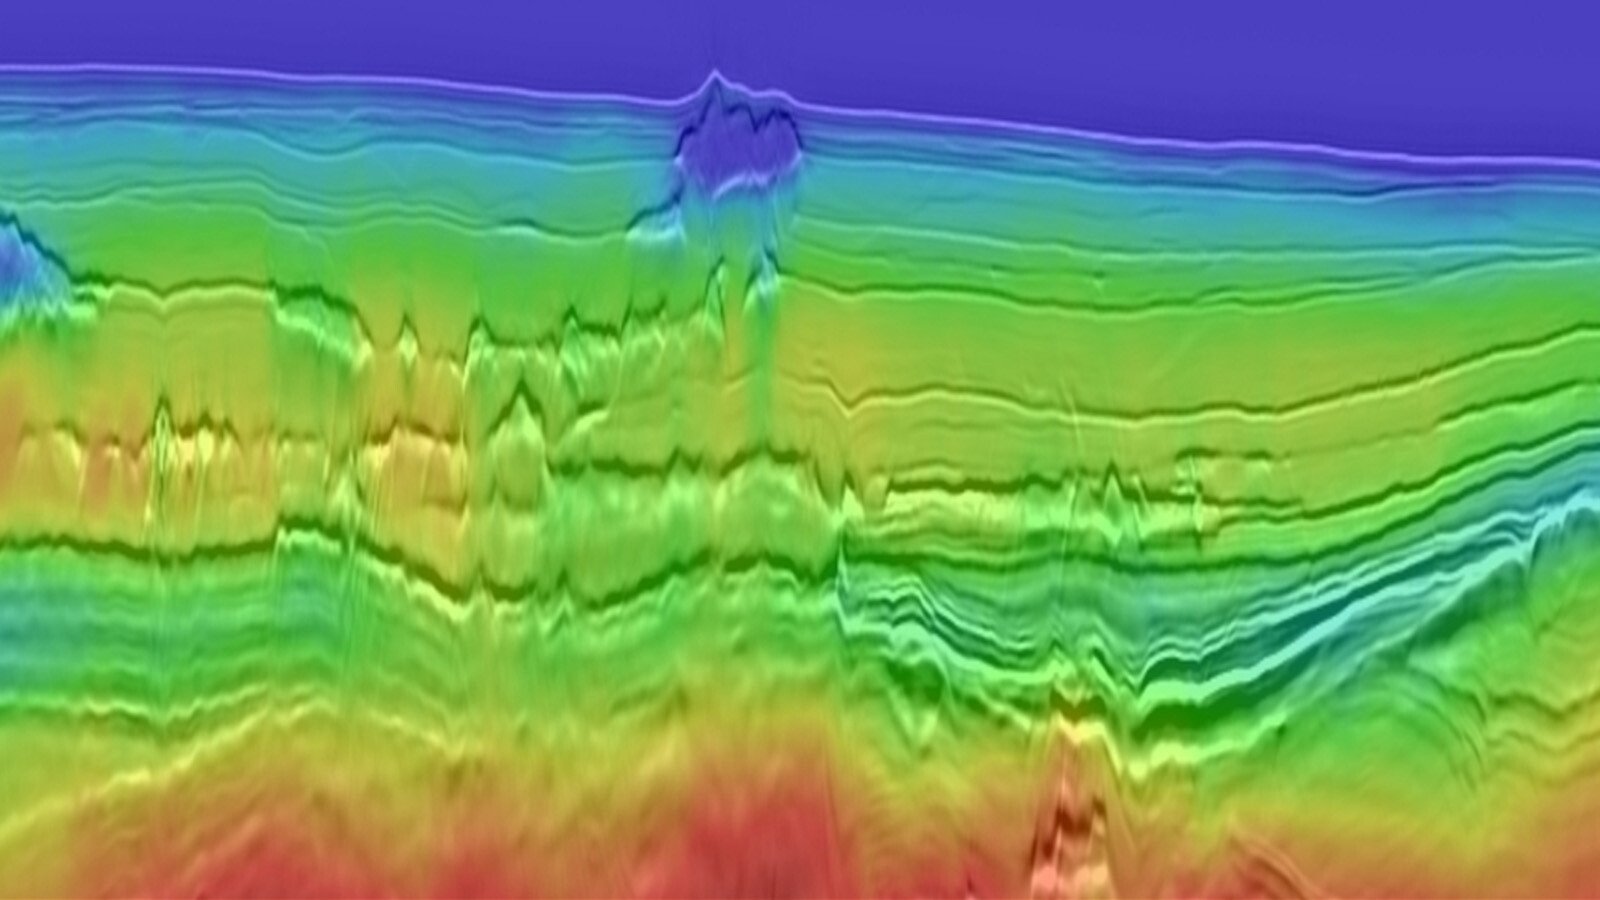
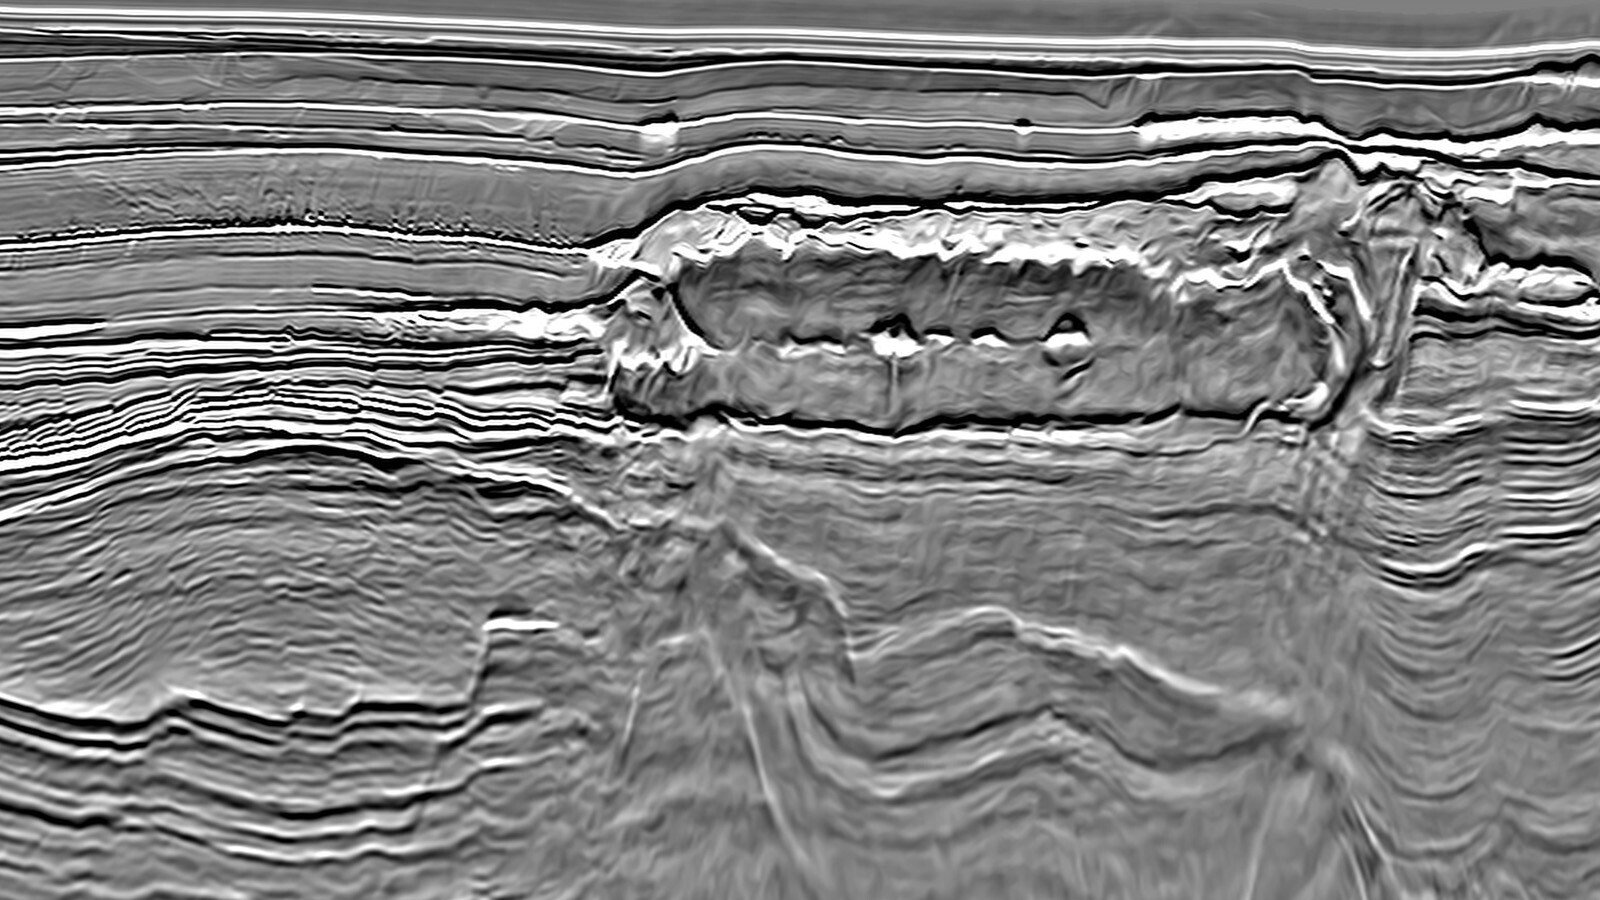
Increasing FWI Frequency to 27 Hz For Superior Delineation of Shallow and Deep Ooze Bodies
12 and 27 Hz velocity model overlays on a 1530 m Q-KPSDM section. Note the resolution of localized ooze features in the 27 Hz FWI velocity model.
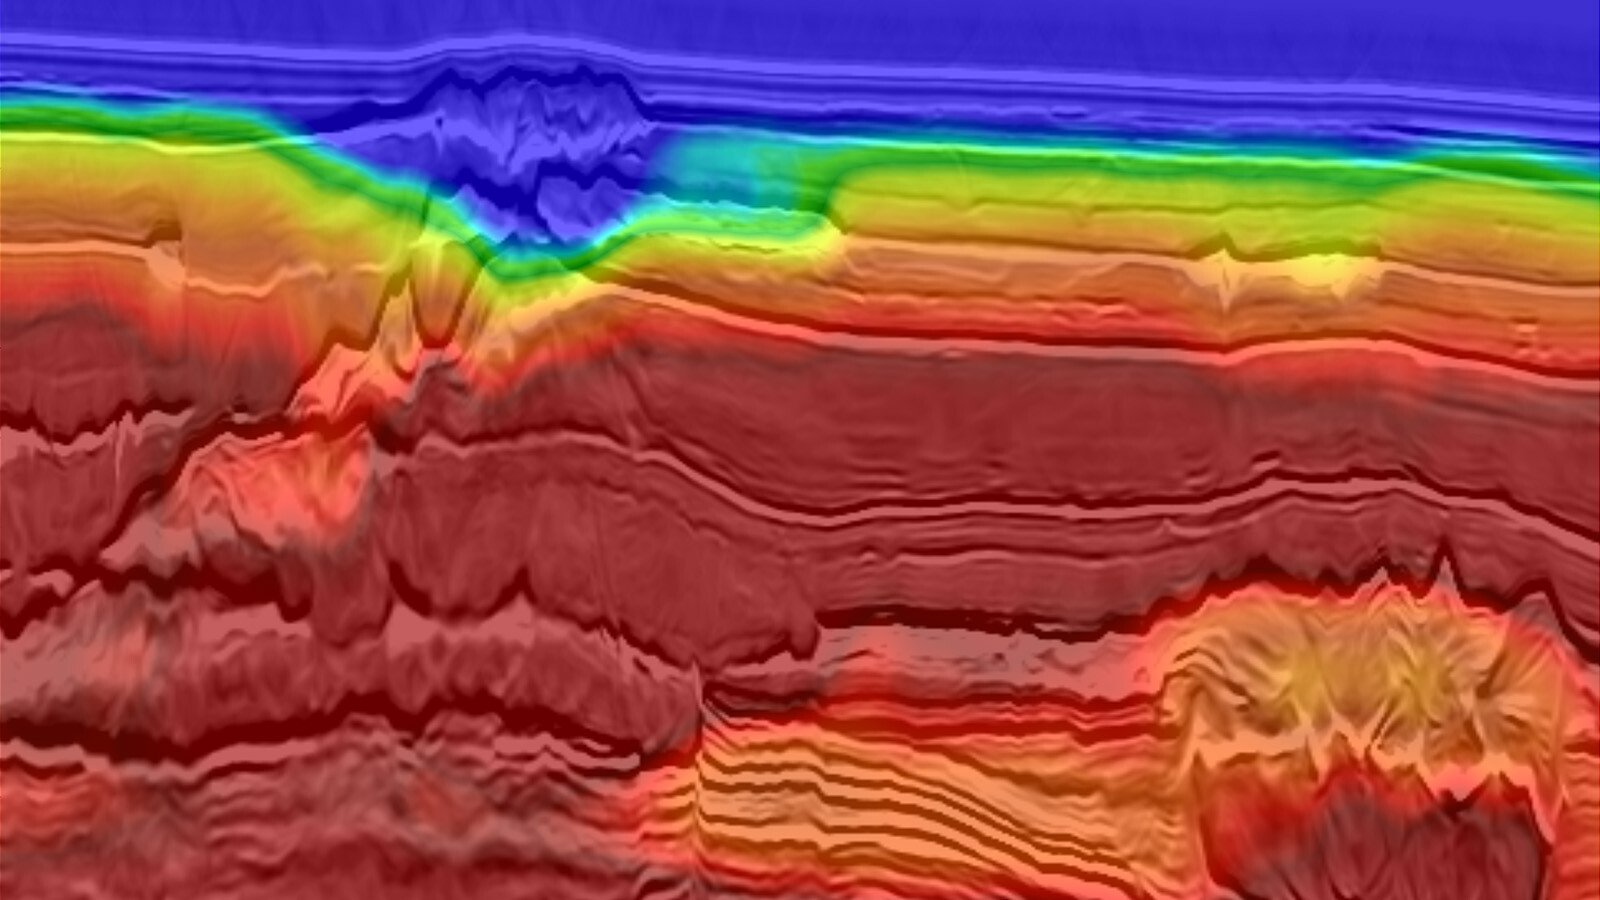
27 Hz FWI + Q-WEM for an Accurate Image
Corrected for Velocity Variations Due to Ooze
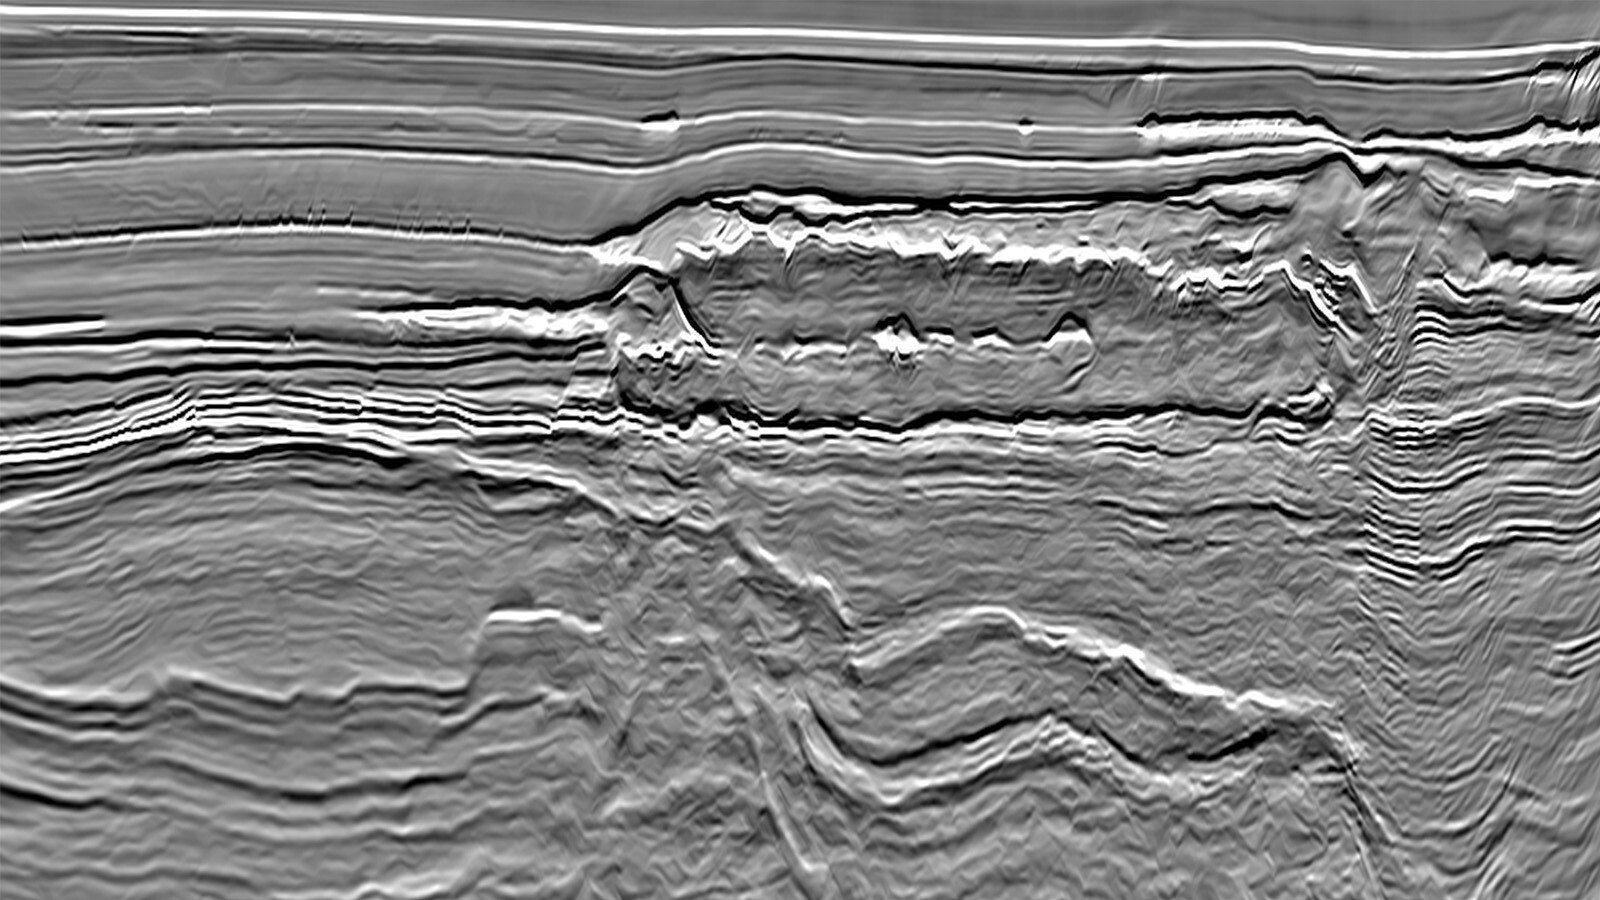
Q-KPSDM run with a 12 Hz FWI velocity model versus Q-WEM run with a 27 Hz FWI velocity model and masked shallow Q model. Note the Q-WEM image is significantly less distorted below the thick ooze body. The resolution of faults and geological contacts and facies boundaries is improved.