Introduction
For geologists and engineers, accurate reservoir characterization is often the difference between economic success and failure. One of the main tools to reduce reservoir uncertainty is drill stem tests (DSTs) which provide key information about formation pressure and fluid characteristics of the reservoir. At its core, a DST is a temporary completion of a given interval before casing is set with two main goals: 1) characterize reservoir pressure and 2) determine
the fluid phases present in the reservoir. Although rarely performed today, DSTs were a primary reservoir evaluation tool between 1950 and 1990. Now, DSTs are predominantly used retroactively to benchmark formation pressure and identify overlooked opportunities.
In a partnership with the American Institute of Formation Evaluation (AIFE), TGS is now the only US data vendor offering report-sourced DSTs (Fig. 1; available through TGS Well Data Analytics). The AIFE DST library comprises 170,000 tests dating back to the 1930s, constructed from a combination of sources including: 1) oil and gas operators such as Amoco and Arco Oil & Gas, 2) testing companies (e.g., Baker Hughes), 3) state agencies (e.g., Midland Energy Library), and 4) private collections (e.g., Petroleum Research Corporation). For the ~150,000 (~88%) tests that are mechanically sound (quality codes A-C & E-F) or mechanically questionable (quality code D), AIFE conducted a Horner Analysis on those mathematically feasible, totaling ~81,000 tests (~48%). The Horner Analysis resulted in an original reservoir pressure, or PMAX, for the individual DST.
Using TGS Well Data processing and mastering, DST data can now be efficiently evaluated at scale. Below we describe a regional and formation level workflow in the Delaware Basin (Pecos, Reeves, Culberson, Loving, Ward, and Winkler Counties in Texas, and Eddy and Lea Counties in New Mexico) that will allow geoscientists and engineers to determine a pressure gradient for hydrocarbon production forecasting models and illuminate depleted or underdepleted zones for water disposal and re-completion, respectively.
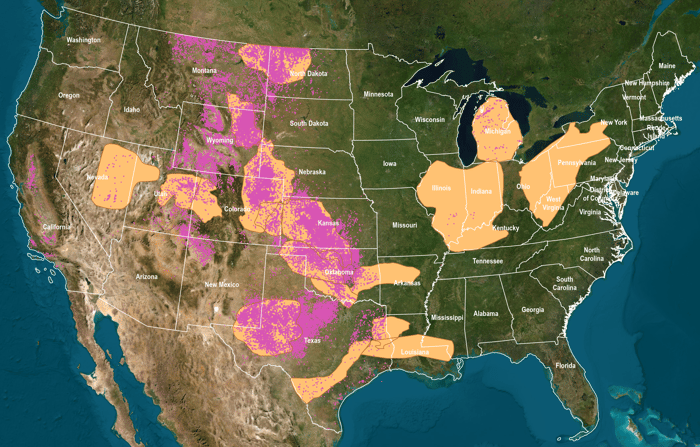 Figure 1. US onshore basins with TGS DST data.
Methodology: Pressure-Gradient Elevation Charts
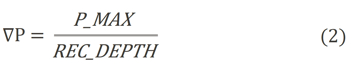
Pressure-gradient elevation charts are the foundation for DST analysis and show how pressure gradients vary with depth. This allows underpressured and overpressured intervals to be identified. The elevation component of the chart is the subsea elevation of the pressure recorder, hrec.
![]()
where REC_DEPTH is the pressure recorder depth (ft). The reference elevation, href, is preferentially selected according to the first value encountered: kelly bushing (KB), drill floor (DF), or ground elevation (GR). The pressure gradient, ∇P, can then be determined for each test.
To create the pressure-gradient elevation chart, ∇P is plotted against hrec to visualize the pressure regimes for each test (Fig. 2A). The tests are subdivided by the dominant fluid recovery, or hydrodynamic factor (HF), determined from pipe recovery amounts (RCV_AMTS_CHAR_X) and descriptions (DESC_RCV_OF_X). Pressure gradients are defined as (1) underpressured: <0.40 psig/ ft, (2) normal pressure: >0.40 psig/ft and <0.465 psig/ft, and (3) overpressure: >0.465 psig/ft (Fig. 2A).
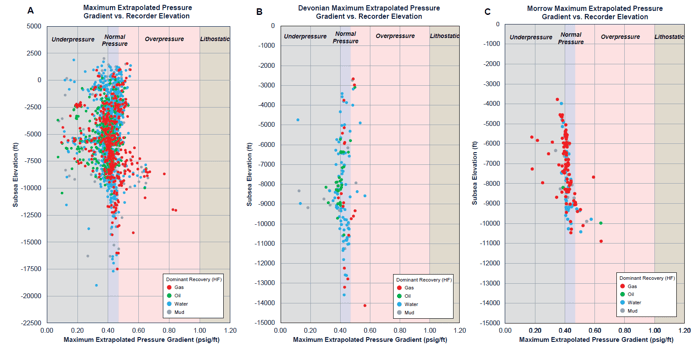
Figure 2. Pressure-gradient elevation chart for the (A) Delaware Basin (B) Devonian and (C) Morrow
Regional & Formation Observations
Based on the regional pressure-gradient elevation chart of the Delaware Basin, tests fall into all three pressure regimes, averaging 0.40 psig/ft. (Fig. 2A). Formations are generally underpressured from the surface to -7,500 ft, overpressured between -7,500 to -10,000 ft, and normally pressured below -10,000 ft (Fig. 2A). This interval of overpressure from the Lower Permian through Lower Mississippian is likely due to the occurrence of two significant seals in the basin: Permian evaporites and upper Devonian Shales. At the formation level, for example, the pressure gradient averaged 0.41 psig/ft in the Devonian compared to 0.42 psig/ft in the Morrow Formation (Fig. 2B). A distinct overpressure signal is apparent in the Morrow below -8,000 ft where the average pressure gradient increases to 0.45 psig/ft (Fig. 2C).
When plotted spatially, pressure gradients can reveal how pressure regimes vary across a basin within individual formations. In the Devonian, the pressure gradient is at the highest in the center of the basin at 0.49 psig/ft, decreasing toward the northwest shelf at 0.39 psig/ft (Fig. 3A). The Morrow formation is only present in the northwest shelf where the gradient drops from 0.48 psig/ft in Lea County to 0.41 psig/ft in Eddy County (Fig. 3B). This spatial variability of the pressure gradient becomes critical when determining absolute pressure values. In the case of the Devonian, using the gradient in the basin center instead of the northwest shelf would result in formation pressure error of 1000 psig and could result in an overestimation of production volumes.
Pressure gradients can also be applied to illuminate depleted or underdepleted zones by comparing pressures from the DSTs to present-day pressures. A depleted oil and gas zone, along with existing underpressured zones, are prime candidates for water disposal. Underdepleted zones, on the other hand, could be overlooked opportunities, potentially becoming economical with new wells or re-completions.
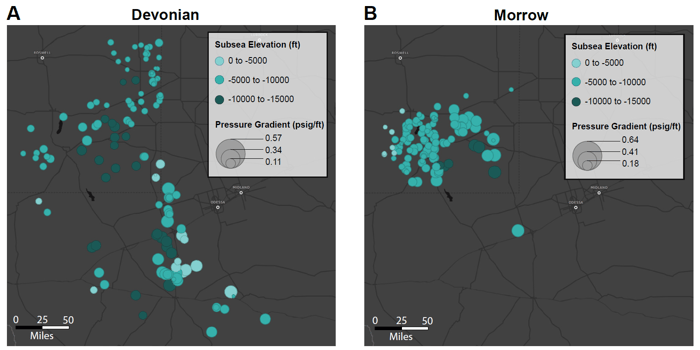
Figure 3. (A) Devonian and (B) Morrow pressure gradient maps in the Delaware Basin.
Summary
TGS DSTs, available through TGS Well Data Analytics, are an invaluable tool for geoscientists and reservoir engineers to characterize formation pressure across a basin. Spatial variability of pressure gradients can have a significant impact on production forecasting models and make or break a proposed drilling program. Pressure gradients can also reveal potential water disposal sites and overlooked investment opportunities.
Here we showed a workflow for utilizing pressure data from DSTs in the Delaware Basin. This workflow can be replicated in many other basins and productive formations across the US as a key reservoir characterization tool.
TGS Well Data Analytics
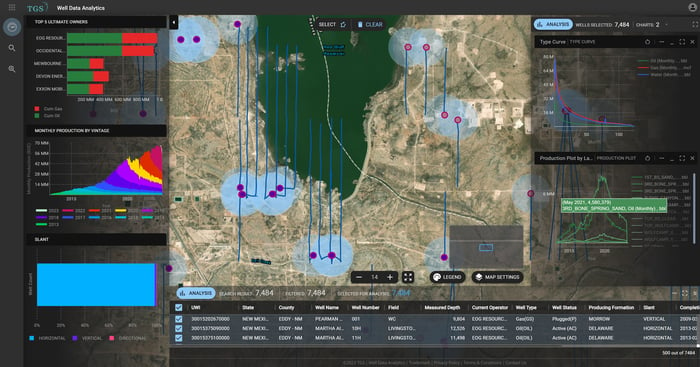
DSTs are delivered through TGS Well Data Analytics, which combines the industry’s largest library of subsurface data, powerful visualization, and advanced analytics. The
application provides users with a streamlined and intuitive experience that enhances productivity across their operations. By leveraging TGS’ extensive data portfolio,
which encompasses every major U.S. basin, this platform offers unparalleled access to highly competitive well data within seconds, enabling efficient analysis and effective decision-making to drive essential business objectives. The streamlined analytics tool also provides fast and
easy access to vast cloud-based well data resources that are already QC’d and ready to use. Learn more or request a free trial HERE.