As Improved and Enhanced Oil Recovery methods are gaining steam in the unconventional space, TGS will be releasing an update to the TGS injection dataset to help assess general trends and the efficacy of these operations. In a previous Well Intel post we used the TGS well performance injection dataset to analyze water disposal trends across Texas and their impact on reservoir pressure. The updated dataset increases coverage to an additional ten states and includes new attributes, such as Injection Type (EOR, Disposal, Storage) and Injection Formation/Pool. As a practical example, we are using these new attributes to take a detailed look at an example of a field where three operators manage waterflood operations with diverging strategies. First, we identify each of the operators’ assets in this field and how the waterflood patterns have been designed, then we analyze the total production response to waterflooding for all wells for each of the operators to see how their field-wide results compare, and finally, we compare the three operators normalized on a per well and per unit of injection basis to account for the varied well density and injection profiles across the field.
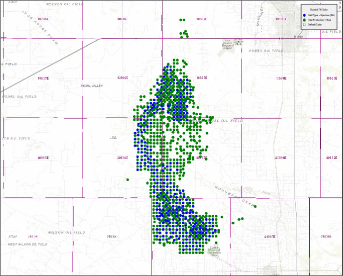 Fig 1 – Waterflood Field Layout
Operator A holds a position on the North flank of the field. Fig 2a shows that the majority of wells are laid out in a regular five-spot waterflood pattern. Fig 2b shows the overall field-wide production for Operator A. Although the onset of injection does appear to correspond with an increase in water production, there is also an immediate jump in oil production. The instantaneous surge in water- oil ratio, and accelerated increase in slope, indicates that there may have been some breakthrough effect, but the simultaneous enhancement of oil decline characteristics indicates positive sweep efficiency.
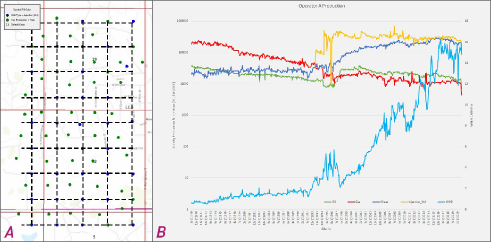 Fig 2a – Operator A Waterflood Design Fig 2b – Operator A Field Production
Operator B holds a position on the south and west sections of the field. Fig 3a shows that the majority of wells on the west section are laid out in a regular five-spot pattern, but on the south section the well spacing decreases, and there appear to be a higher number of off-pattern wells. Fig 3b shows that there is an immediate jump in water production at the onset of injection for Operator B, and a much more muted response in oil production. This response is duplicated in the sharp jump in the Water Oil ratio, and could indicate a partial breakthrough and poor sweep efficiency. In fact, a study from JPT1 shows that off-pattern wells tend to degrade overall waterflood performance by significantly lowering the expected oil recovery at the time of breakthrough.
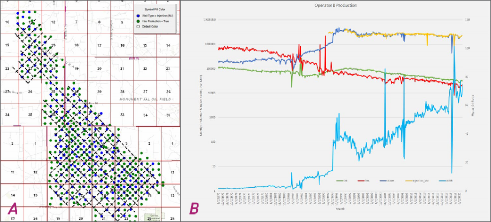 Fig 3a – Operator B Waterflood Design Fig 3b – Operator B Field Production
Operator C holds a much smaller position on the east section of the field. Fig 4a shows that the waterflood pattern here appears closer to an inverted nine-spot pattern, which significantly increases the ratio of producing wells to injection wells. Fig 4b shows that, although the onset of injection does correspond with a brief spike in water production, injection rates were quickly normalized, which brought water production back in line with pre-injection trends. Here, however, we see a much smaller jump in instantaneous production, but we also see a minor upward trend in oil decline rate after the onset of injection. This response seems to track closely to expectations given the decreased injection to production well ratio in the inverted nine-spot compared to the five-spot pattern.
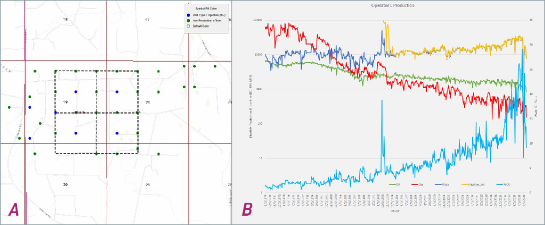 Fig 4a – Operator C Waterflood Design Fig 4b – Operator C Field Production
Fig 5 and Fig 6 show the normalized production per well and normalized production per well per barrel of water injected, respectively. As discussed previously, after the start of waterflooding, oil production per well increases sharply for Operator A and increased moderately for Operator B and Operator C. However, when normalized by well and barrel of water injected, we see that Operator C has the highest marginal oil production per injection rate, followed by Operator A and Operator B. These results confirm our previous suppositions that well-spaced five-spot waterflooding yields a strong production response, while a nine-spot pattern appears to be more efficient on the basis of injection volume.
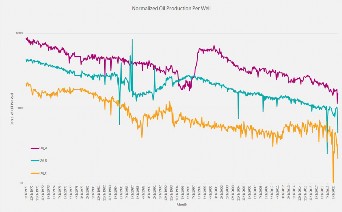 Fig 5 – Normalized Oil Production Per Well
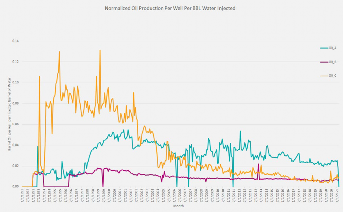
Fig 6 – Normalized Oil Production Per Well Per BW
Although waterflood and EOR designs are heavily dependent on geology, reservoir structure, and in-situ reservoir fluids, there are still plenty of insights that can be learned from evaluating existing applications of injection design and results. Using TGS well performance injection data, we mapped injection and production wells to elucidate waterflood strategies taken by different operators. Overall cumulative injection and production volumes can then be used to evaluate the expected result of a waterflood operation, and normalized production and injection volumes can be used to evaluate the efficiency of the many variables used in waterflood and EOR design.
References:
1) Prats, M., Hazebroek, P., and E.E. Allen. “Effect of Off-Pattern Wells on the Performance of A Five-Spot Water Flood.” J Pet Technol 14 (1962): 173–178. doi: https://doi.org/10.2118/170-PA