New Play Shows Promise to Drive Future Production Growth
Earlier this month, Continental Resources announced an addition of Midland Basin acreage specifically acquired to test the Barnett Shale. Continental adds to a growing list of operators testing the Midland Barnett in hopes of finding a deeper target to enhance existing inventory of Spraberry and Wolfcamp acreage. Boosting those prospects are much higher oil cuts compared to the Fort Worth Barnett, averaging about 65%.
According to TGS Well Data Analytics, over 80 wells have tested the Midland Barnett since 2016, with production growing to nearly 20 MBOE/d in the fourth quarter of 2023 (Figure 1). On a BOE per foot of lateral length basis, Barnett wells reported a peak rate of 2.9 BOE/ft versus 2.2 BOE/ft from Spraberry wells and 1.5 BOE/ft from Wolfcamp wells. Over the life of production, the Barnett also exhibits a shallower decline rate and a higher EUR/ft, averaging 0.69 EUR/ft, 10% higher than the Spraberry and 25% higher than the Wolfcamp. Although the Barnett produces a higher GOR, the water cut produced is much lower, averaging 44% compared to 68% and 73% for the Spraberry and Wolfcamp, respectively.
Using the newly launched well economics dataset within TGS Well Data Analytics and assuming current commodity prices, Spraberry wells returned a positive NPV at $2.5 million and 19% IRR. Although the variable costs are significantly lower for Barnett wells due to a lower water cut, high GORs ultimately cause the wells to flash negative NPVs at gas prices below $2.5/mcf. On average, Barnett wells produce 3822 cf/bbl compared to 2426 cf/bbl for the Spraberry and 3437 cf/bbl for the Wolfcamp, largely due to higher source rock maturation from a deeper structural position. Overall, the Barnett remains a frontier play and new datasets, such as TGS’ Pontiac 3D survey, will be a key driver to completing new target zones and raising the economic prospects of the play.
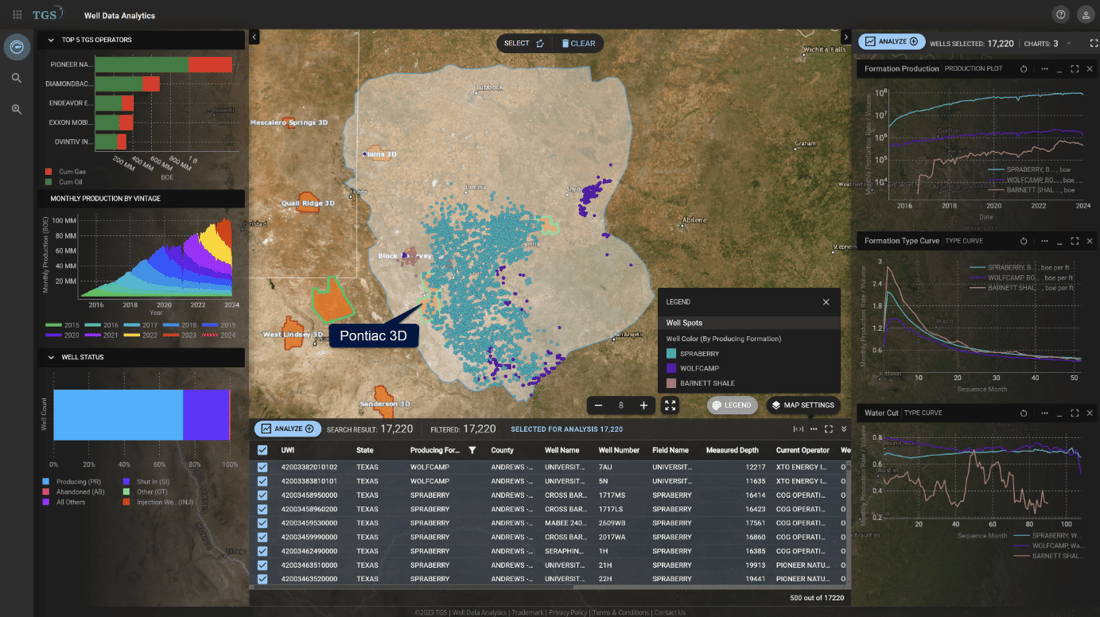
Figure 1. Barnett, Spraberry, and Wolfcamp producing wells in the Permian Basin. Included in the plots on the right-hand side are, from top to bottom, formation production, type curves, and water cuts using 2016 to present datasets.
For further details on Well Data Analytics or to schedule a demo, please contact us at WDPSales@tgs.com.