As global economies gradually emerge from the Covid-19-induced contraction, the U.S. Energy Information Administration (EIA) estimates an increase in global oil demand of 6% in 2021. The supply side, on the other hand, shows a different trend. TGS analysis indicates a dramatic decrease in rig count, well shut-ins (see our June 2020 article), high decline rates in unconventional wells and other challenges associated with shale production point to lower U.S. oil output in the near-term. Environmental ambitions of the new U.S. Administration limiting development on federal acreage could further exacerbate the situation. U.S. rig count decreased dramatically over the course of 2020 from around 790 rigs in January to around 250 at the height of the summer, as seen in Figure 1. Activity levels recovered somewhat in the Fall, with rig counts increasing to about 380 by the end of January of this year. Oil production follows the trend in rig counts. The U.S. finished 2019 as the largest oil producer in the world, with a record-high 12.8 mmbpd oil production. 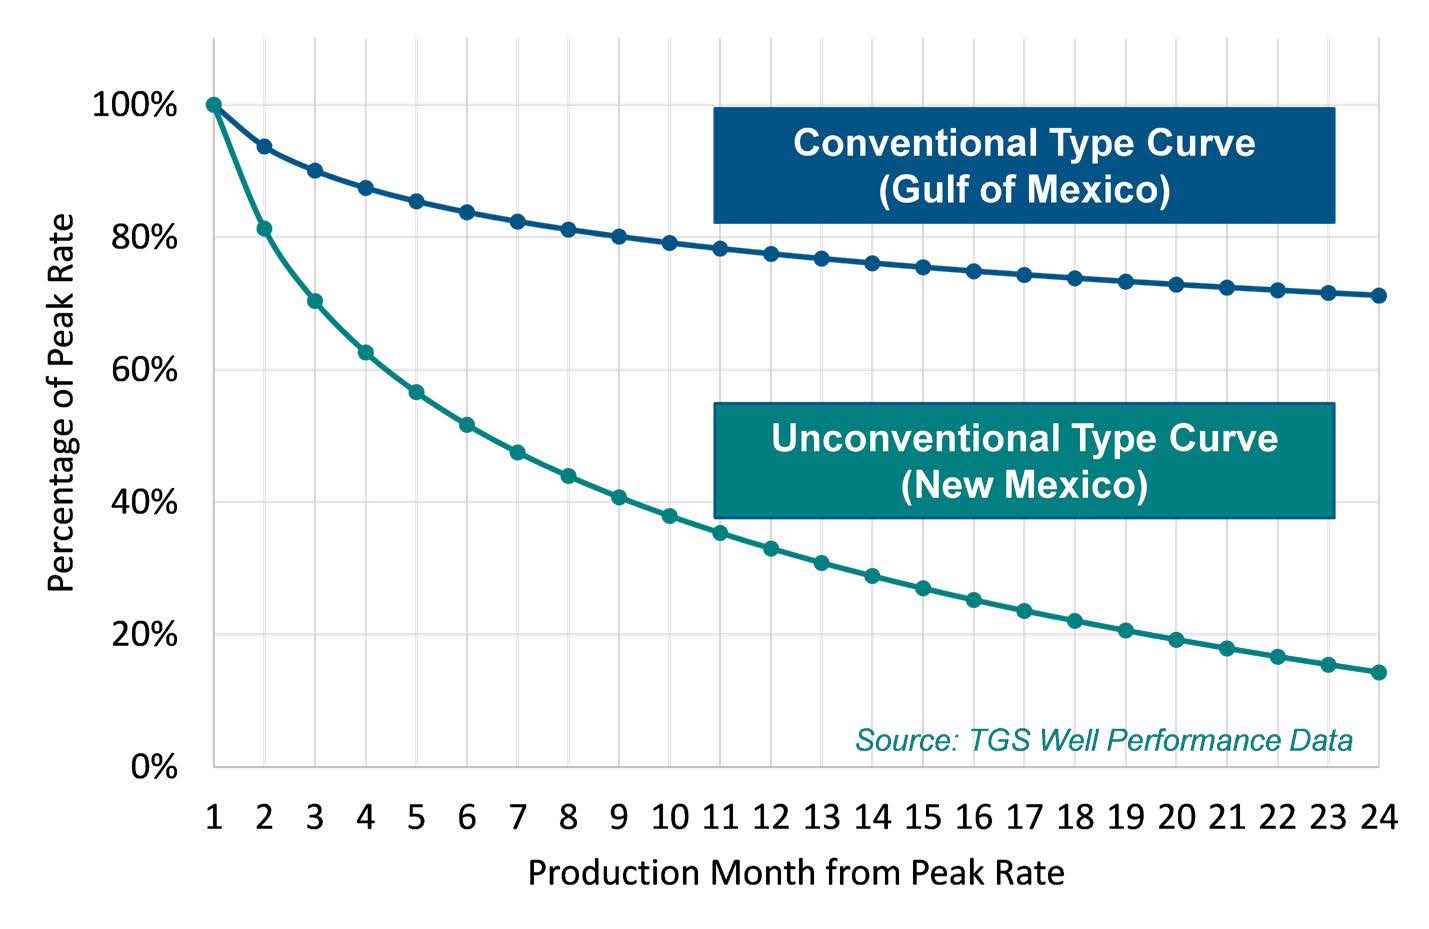
Fig 1 – Average U.S. daily oil production by month and average U.S. daily rig count by month
The rapid decrease in drilling activity resulted in a drop in oil production to around 10.4 mmbpd by the middle of the year, a decrease of almost 20%. As production curtailments tapered off and drilling activity increased, production recovered slightly to a level of 11.1 mmbpd in January 2021. Shut-in wells aside, this degree of volatility highlights the high initial decline rates of shale wells, which contribute around 70% of U.S. oil production. First year declines of 50-70% are standard and diminished supply of new wells with high initial flow rates to sustain production levels set us off on a trajectory that we expect to continue. Our October 2020 article highlighted the challenge in returning to record 2019 oil production due to potential issues around reservoir deliverability and parent-child interference in shale wells. With updated production data our conclusion holds firm. Figure 2 shows that at current activity levels, oil production will average around 10.0 mmbpd by the end of the year. Increasing rig count at an aggressive pace of 40 rigs per month starting in March would reach pre-Covid levels of 780 by December and could add 1.5 mmbpd to U.S. production. This, however, is a best-case scenario and assumes no degradation in well performance due to worsening geology in non-core areas or well interference.
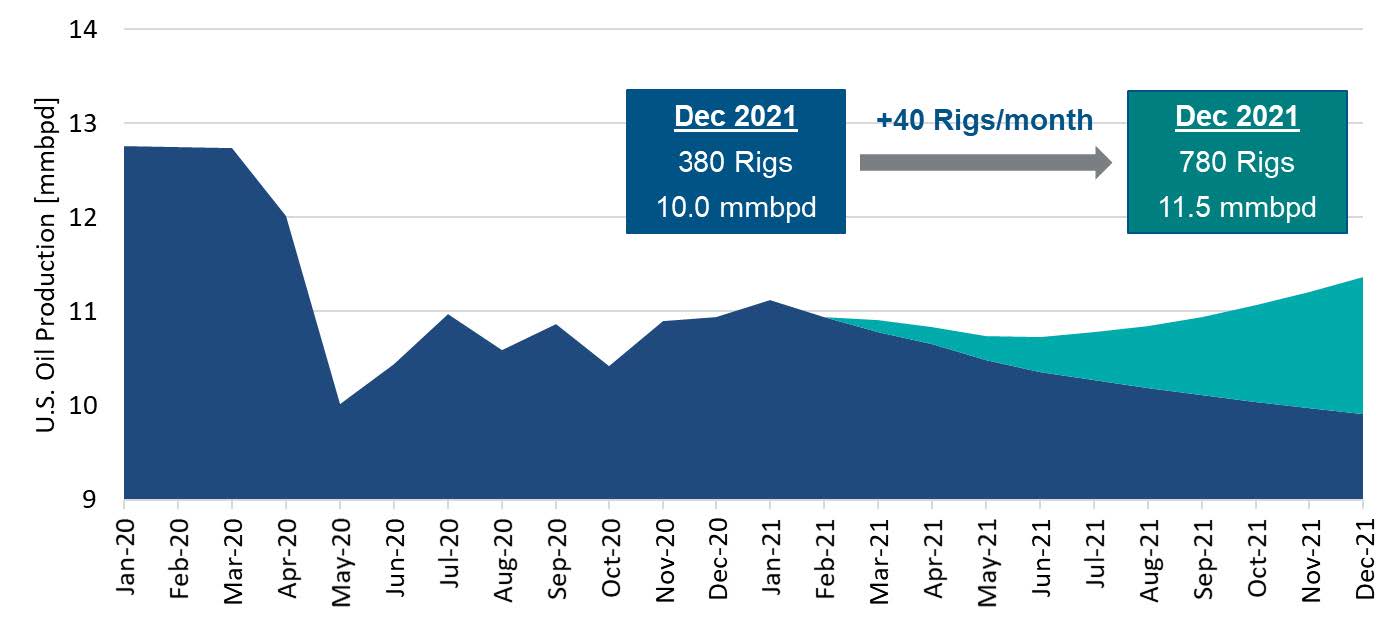
Fig 2 – Average U.S. Daily Oil Production incl. forecast for additional rigs.
The above analysis does not take into account geopolitical influences on U.S. production. Initial moves by the new Biden Administration and its environmental agenda bring into question the future supply from federal lands and waters. In recent executive orders, the Department of the Interior (DOI) suspended the leasing program in the Arctic National Wildlife Refuge (ANWR), delegated the authorization of new oil and gas leases and drilling permits on federal acreage to a handful of new political appointees within the DOI, and then initiated a comprehensive review of permitting and lease decisions while temporarily suspending award of new leases. Production from federal acreage is significant. In recent years, 20-25% of total U.S. oil production came from wells under the jurisdiction of the Bureau of Land Management (BLM) or the Bureau of Ocean Energy Management (BOEM). Unconventional hot spots like New Mexico and Wyoming account for about 10% of new wells, almost all of them unconventional shale wells, and more than 75% of those wells are on BLM acreage. The Gulf of Mexico (GoM) is almost entirely governed by the BOEM and represented 12% of U.S. oil production last year.
Industry commentators have suggested that a drilling moratorium and permanent ban on offshore leasing is unlikely, pointing to concerns around national energy security, federal revenue from leasing bonuses, and production royalties. Additional aspects such as the federal government’s obligation to develop public lands under the Mineral Leasing Act, and the relatively low carbon intensity of GoM production will certainly influence decision-making as well. Indeed, a November 2016 study from the BOEM concluded that shifting production away from the GoM to other countries would actually increase global GHG emissions*. In a worst-case scenario of no new drilling on federal lands, and assuming operators cannot pivot quickly enough to private lands, TGS analysis indicates that the impact on U.S oil production would be a decline of up to 1 mmbpd by the end of 2021. However, most operators seemed to anticipate action by the incoming administration, and they prepared and acquired plenty of inventory for future development. A fact sheet released by the DOI states that over 50% of federal onshore leases are unused and non-producing. Over 75% of leases currently do not have any oil and gas activity on federal waters. We see a similar story for drilling permits. According to TGS data, there are currently more than 6,800 approved permits to drill on federal acreage. Our analysis indicates that operators have built up a two-year buffer against the risk of a leasing and drill permit moratorium.
The major driver for U.S. production in the short term will therefore be the aftermath of record low levels of drilling activity in 2020 and the high decline rate of shale wells. While aggressively ramping up rig count could mitigate a further drop in U.S. output, this seems unlikely given flat CAPEX budgets in 2021 for most U.S. operators. Assuming demand continues to recover as the COVID-19 vaccination roll-out accelerates, then our analysis of TGS data suggests that we could be facing a U.S. supply squeeze in the short to medium term that would surely drive up commodity prices.