Derisking Injectites and Revealing Near Field Potential

GeoStreamer data is resolving potential super producers in the North Sea. Derisking these thin injectite bodies is possible with reliable lithology and fluid properties.

location-pin

The Location

Location

Viking Graben, North Sea

Survey

Merged and reprocessed

Survey Type

3D GeoStreamer

Configuration

Various

Survey Size

18 000 sq. km

Water depth

125 m

GeoStreamer PURE Viking Graben offers ~18 000 sq. km of 100% broadband GeoStreamer depth data and provides the structural overview and reservoir details you need to unlock new leads and opportunities in this region. Shown with the orange outline alongside adjacent TGS data library coverage in the area.

MagnifyingGlass

The Challenge

The Challenge

Thin sand bodies called injectites are abundant in the area and have extremely high porosity and permeability making them potential targets with very high production rates. The challenge is that injectites are thin, difficult to resolve and require detailed prestack broadband GeoStreamer processing and characterization.

cs-challenge-image
light-bulb

The Solution

Data

GeoStreamer PURE

Velocity Model Building

FWI and hyperTomo

Migration

Q-Kirchhoff prestack depth

Well ties

Pre-stack

Rock physics

Regional

QI

Seismic driven inversion (no well information)

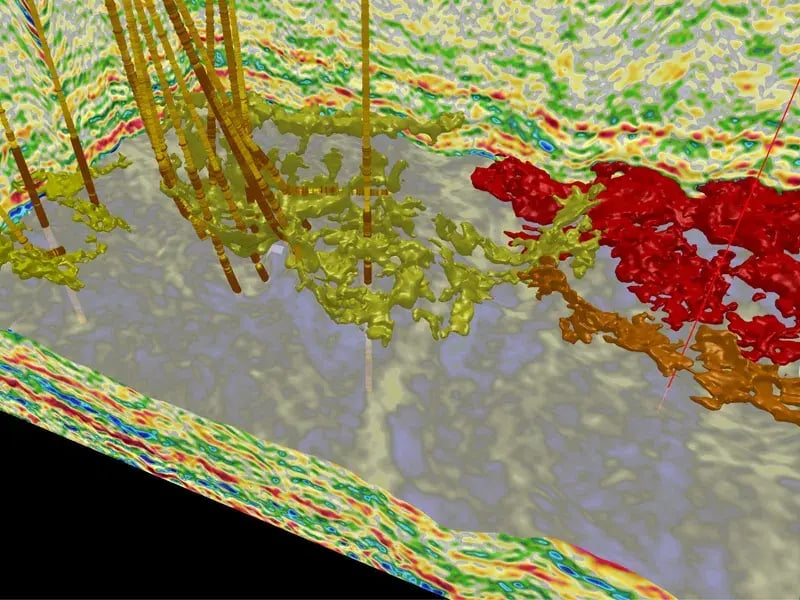
Recently reprocessed broadband GeoStreamer data contains both high and low frequencies to resolve thin sand bodies (injectites), reduce sidelobe artifacts, and allow accurate reflector picking. A regional rock physics approach using well data from fields and discoveries provides information on the elastic properties of reservoir lithology and fluid content. The prestack GeoStreamer data shows good correlation with the rock physics analysis and provides reliable estimations of rock and fluid properties away from the wells. Proving therefore that GeoStreamer data help derisk the interpretation and evaluation of these sand bodies.

Volund Successful Well
Excellent Well-To-Seismic Tie

Before Image After Image
Vp/Vs
Acoustic Impedance
Left side: relative Vp/Vs analysis helps to characterize the rock type and here suggests a number of potential reservoir sands. Blue, low Vp/Vs, indicates a high likelihood of reservoir sands.
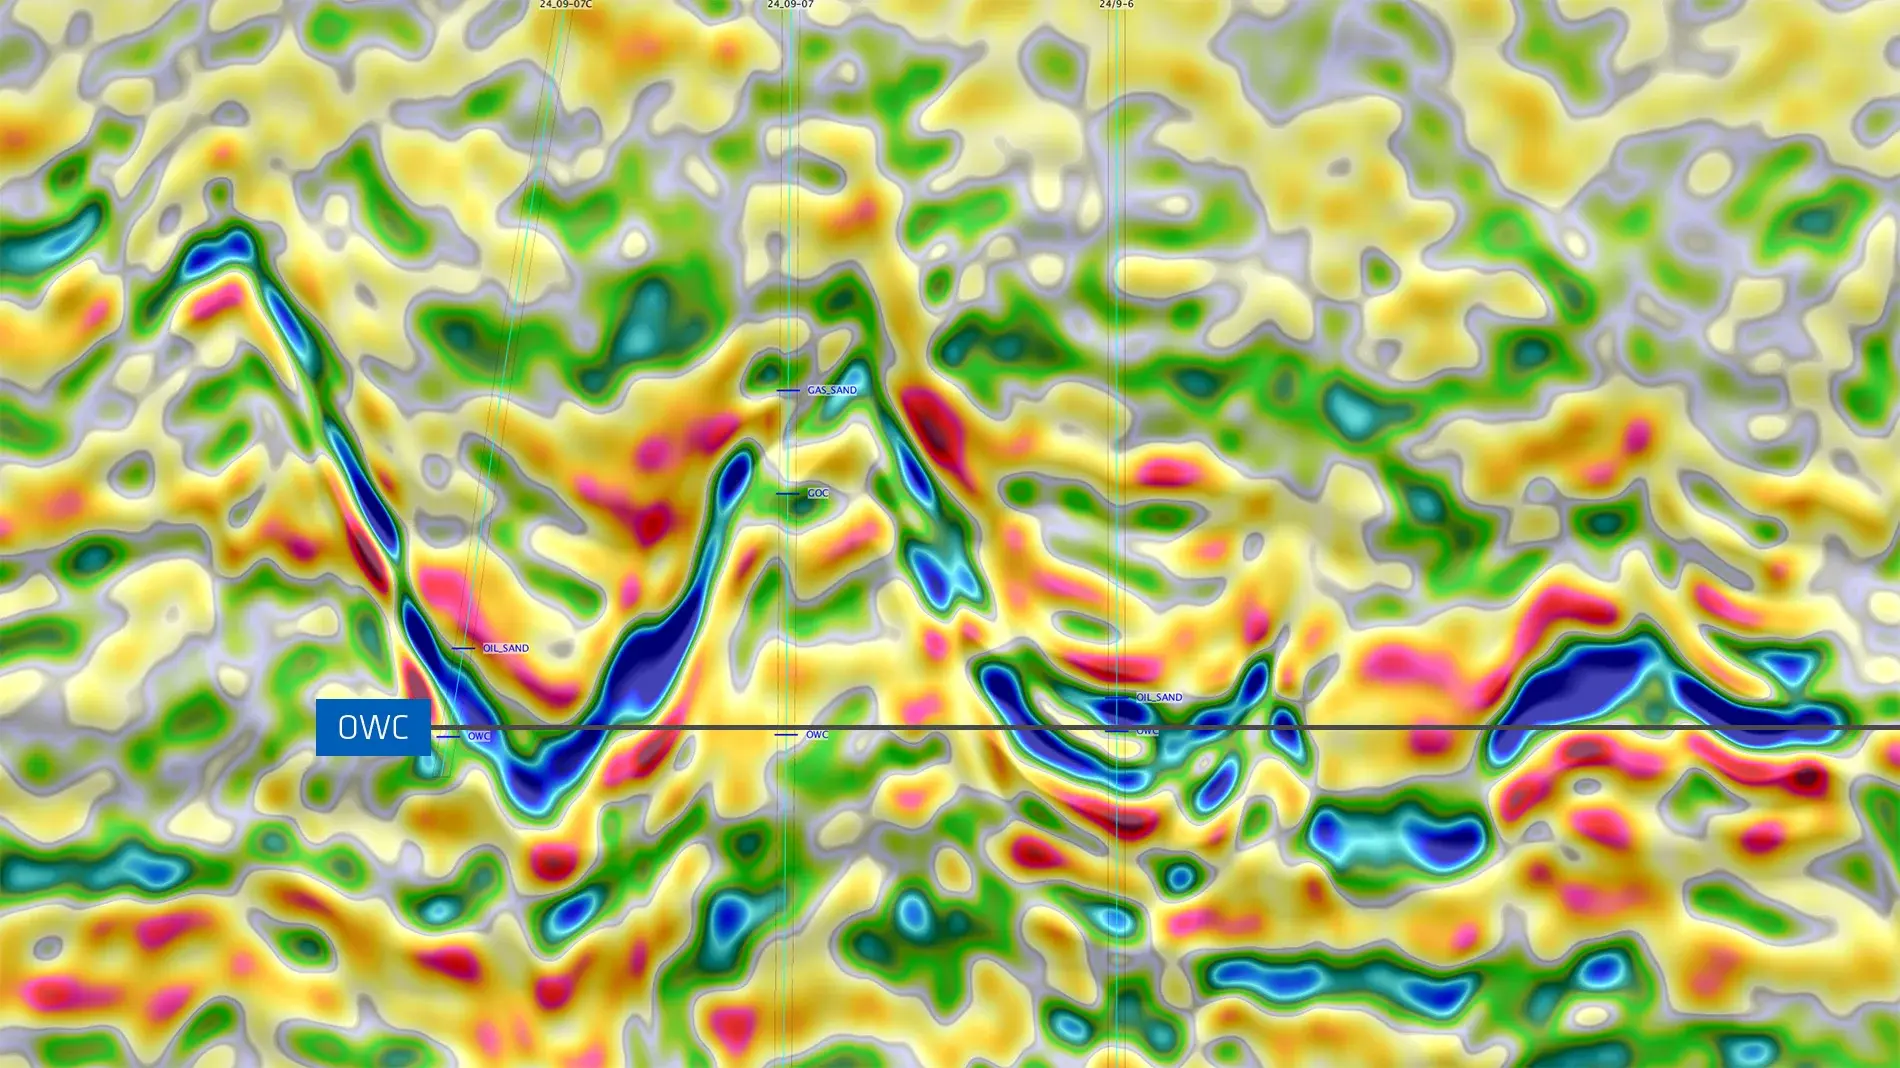
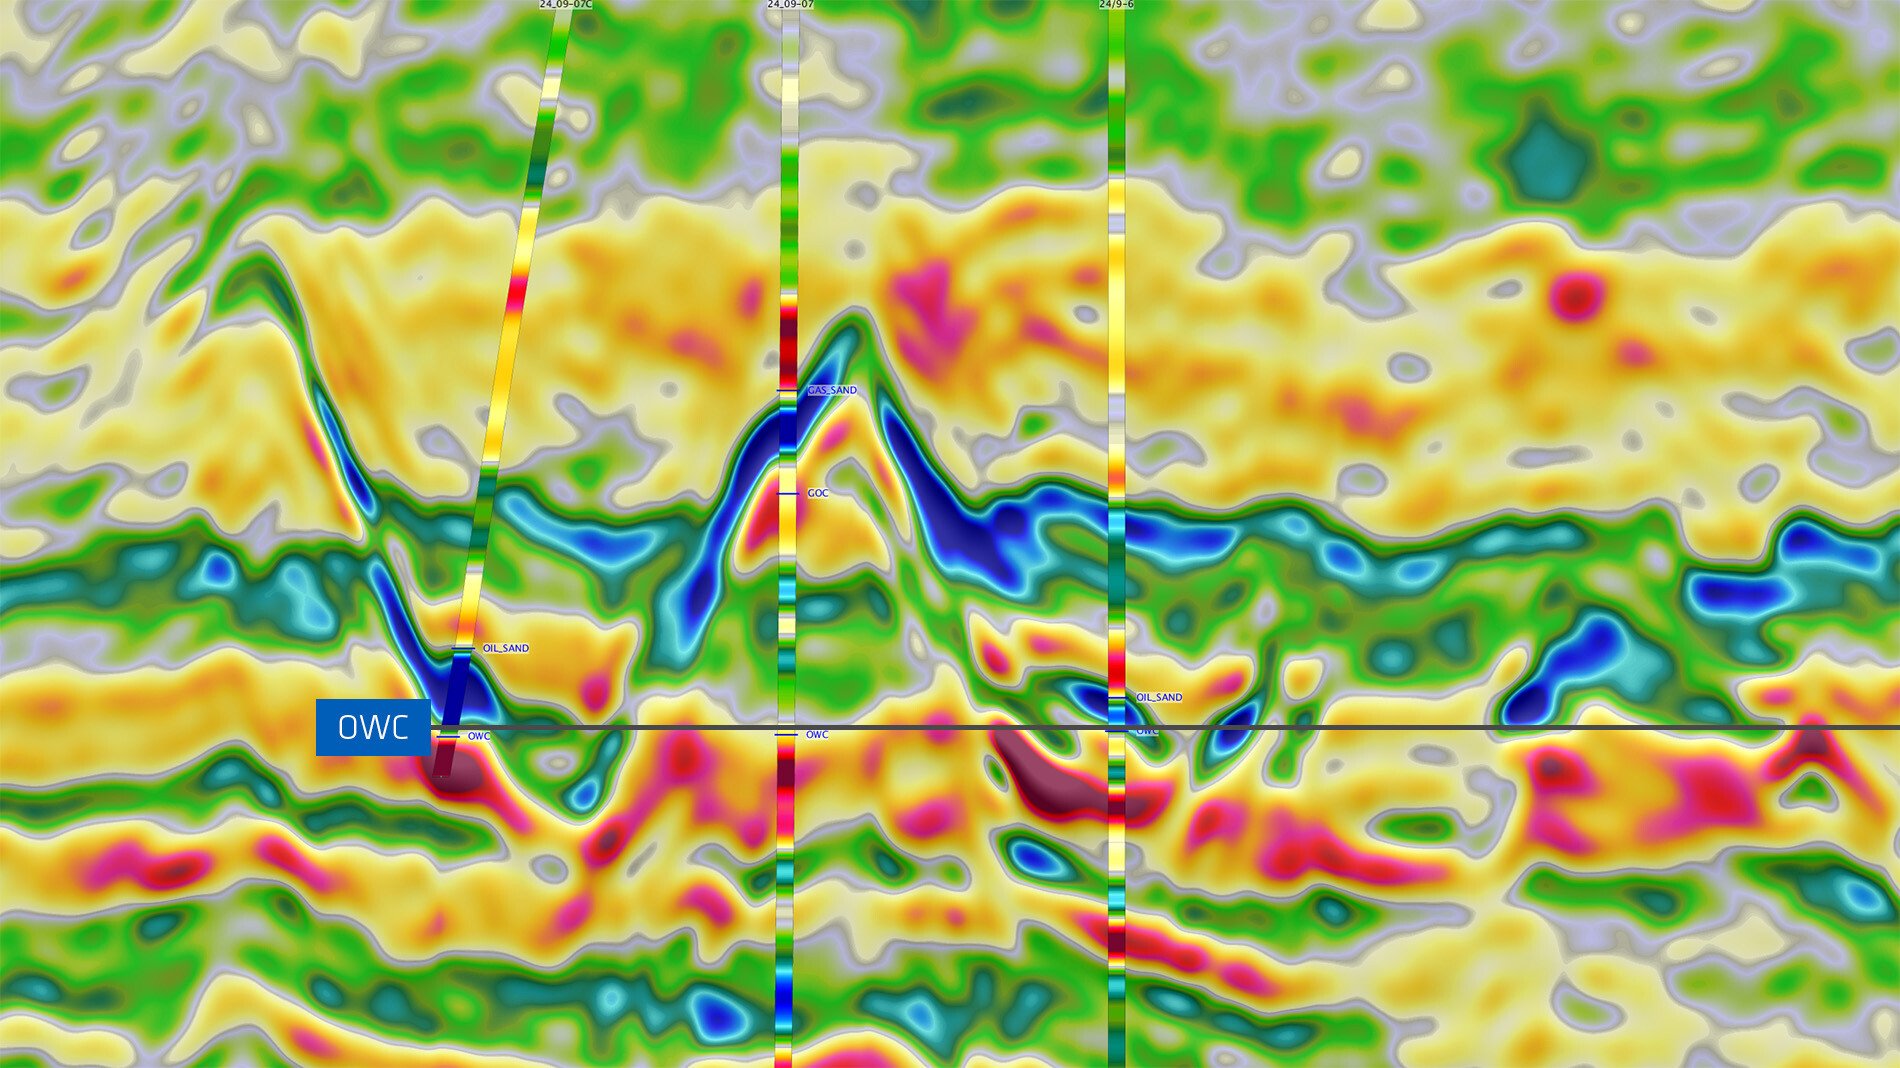
Right side: relative acoustic impedance results indicate what kind of fluid might be present. In zones with low Vp/Vs low acoustic impedance (blue) shows hydrocarbon potential. At the well location, the impedance log is displayed in the seismic frequency bandwidth.
light-bulb

The Results

Detailed Analysis Can Unlock Nearfield Potential

Previously unresolved injectites have been uncovered with merged and reprocessed GeoStreamer data over this large area. Good correlation is observed between GeoStreamer-derived elastic properties and well-log attributes. This type of detailed analysis can unlock nearfield potential, resulting in new fields, like Frosk.

animationspeedup-v2