Drilling Down the Top Producing Gas Formations and Their Impact on Global LNG Exports.
In 2023, the United States claimed the title of the world's largest exporter of liquefied natural gas (LNG), surpassing leading suppliers Australia and Qatar. According to TGS well performance data, Texas leads as the top producer of natural gas in the United States, contributing 24.6%, followed by Pennsylvania at 21.8%, Louisiana at 9.9%, West Virginia at 7.4%, and Oklahoma at 6.7%.
Utilizing TGS Well Data Analytics to drill down to the top formations is creating an impact. The Marcellus, Spraberry, Haynesville, Wolfcamp, and Eagle Ford formations are the top producing gas formations in the lower 48 United States.
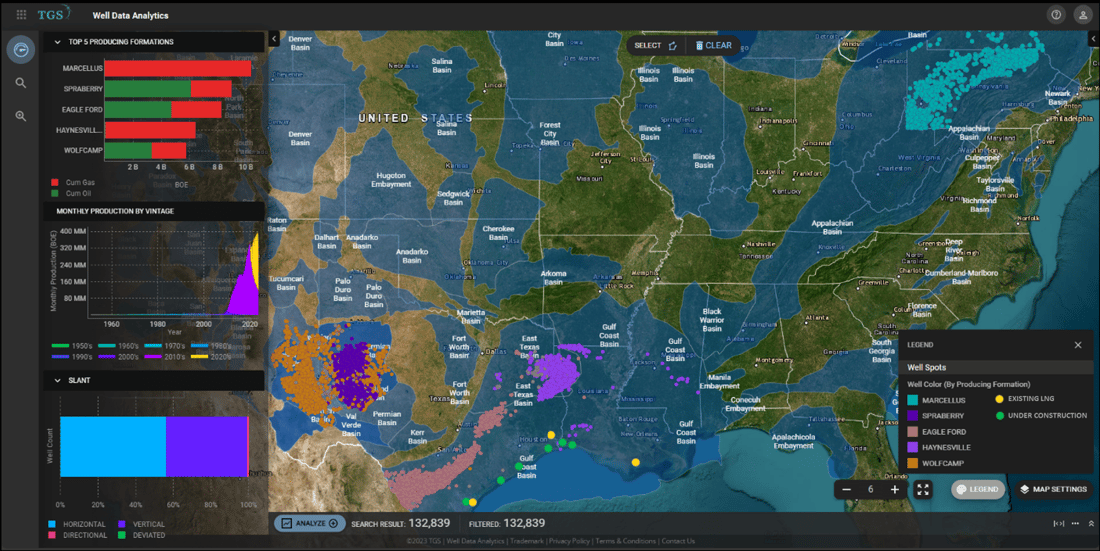
Figure 1. The top producing formation making an impact in the oil and gas industry in the US, overlay of TGS Major Basins outline (blue) and the existing (yellow) and new under construction (green) LNG facilities. Figure generated using TGS Well Data Analytics.
The Marcellus Formation in the Appalachian Basin is the biggest natural gas source in the U.S., producing 24.14 bcf/d, and is one of the leading formations contributing to the demand for LNG exports. Additional pipeline capacity will be needed for Marcellus to supply natural gas to the new LNG facilities located on the Gulf Coast. New liquefaction facilities in Louisiana became fully operational in 2022, ahead of schedule. In addition, new LNG trains in Texas are scheduled to be online by 2025, as illustrated in Figure 1.
In the meantime, the basin will continue to play a critical role in supplying other non-LNG related natural gas demand in the Midwest and the Northeast regions.
Other natural gas producing regions are better positioned to provide natural gas to meet LNG feedstock demand due to the proximity to LNG infrastructure. In Texas, the Spraberry and Wolfcamp formations in the Permian Basin produce 13.10 bcf/d. The Eagle Ford Formation produces 5.35 bcf/d. The Haynesville Formation in East Texas is also a significant source of natural gas as illustrated in Figure 2, generated with TGS Well Data Analytics.
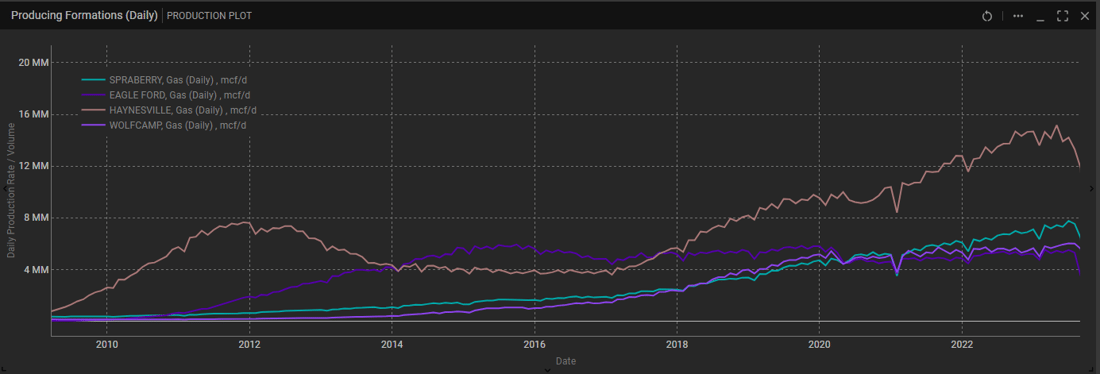
Figure 2. A historical BOE daily rate/volume production plot generated using TGS Well Data Analytics analyzing TGS well performance data in the top producing gas formation along the coast near LNG infrastructure in Figure 1.
This achievement highlights the United States’ robust energy infrastructure and capability to meet global demand for natural gas. New export terminals along the Gulf of Mexico coast are expected to facilitate a significant increase in U.S. LNG exports. This may result in U.S. LNG exports doubling in the next four years, a remarkable milestone.
For more information on Well Data Analytics or to schedule a demo, contact us at WDPSales@tgs.com.