Combined Company to Expand Usage of 3-Mile Laterals in Newly Acquired Acreage
Last Wednesday, Chord Energy announced the acquisition of Enerplus in a stock and cash transaction valued at $11 billion. The merger will add 236,000 acres to Chord’s portfolio, raising its net position to 1.3 million acres in the Williston Basin. According to full year 2023 guidance, the combined company will produce 254 MBoe/d across the Williston, distinguishing itself as the largest operator by volume.
As part of the announcement, Chord indicated the new acreage would be leveraged to continue its expansion of 3-mile laterals. Using TGS Well Data Analytics, we evaluated well performance of these two operators and determined that, on a per foot of lateral length basis, Enerplus’ acreage produced a peak of 3.3 BOE/ft versus Chord’s 2.7 BOE/ft. However, if Chord’s 2-mile and 3-mile laterals are separated, the peak is 2.8 BOE/ft for 2-mile laterals and 2.5 BOE/ft for 3-mile laterals. The 3-mile laterals demonstrate a more gradual decline rate, largely in line with Chord’s expectations of “flatter for longer” production with lower IPs in the 3-mile versus the 2-mile laterals.
Since 2022, Chord has increased the proportion of 3-mile laterals from 20% to a projected 66% in 2024. Using the newly launched well economics dataset within TGS Well Data Analytics and assuming that wells drilled in the new acreage are 3-mile laterals, the 552 new Williston locations generate a valuation of $7.0 Billion. Combined with the PDP wells, which are forecasted to return $3.1 billion NPV, total Williston production is valued at $10.1 Billion. This compares to $11.1 billion announced transaction value allocating ~$1 billion to the non-operated Marcellus assets. This deal underscores a busy year of consolidation across the industry and positions Chord to remain atop the Williston for the foreseeable future.
For more information on Well Data Analytics or to schedule a demo, contact us at WDPSales@tgs.com.
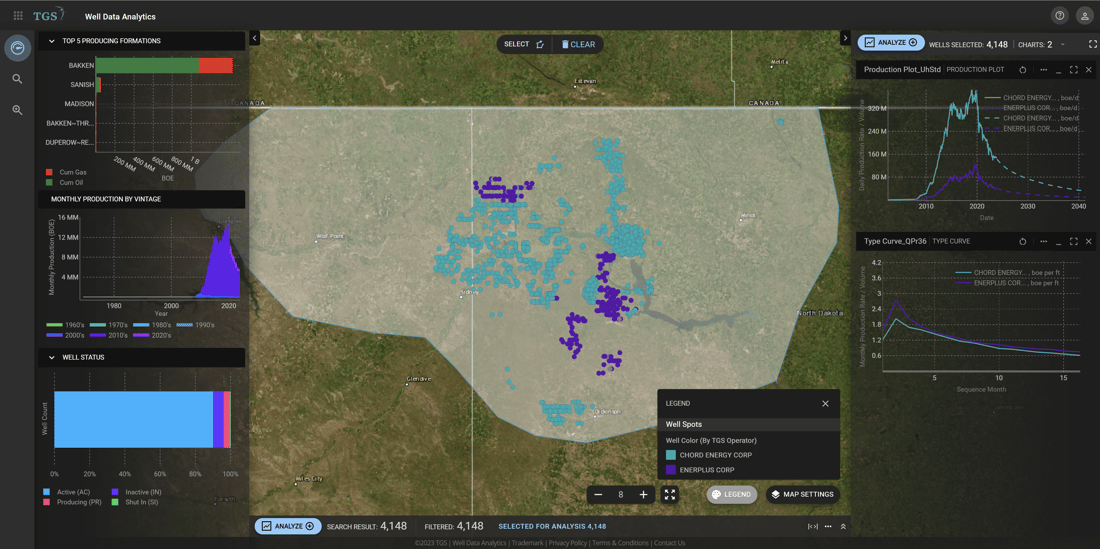
Figure 1. Well distribution of Chord Energy and Enerplus along with the overall boe/d production and gross type curves.
-1.png?width=1100&height=536&name=MicrosoftTeams-image%20(25)-1.png)
Figure 2. Chord 2-mile and 3-mile type curves compared to Enerplus 2-mile type curves in the Williston Basin.