A unique view of the timeline and the amount of energy that will be produced by offshore wind in the US market.
The addition of electricity sourced from offshore wind will provide a new, fluctuating input to energy grids in the US, creating income for those who operate them and competition for existing electricity providers. But how much electricity will this new source generate? And when will that energy really come on-stream? These answers are provided by the unique views driven by TGS’ market intelligence and wind resource data platforms.
Forward-looking production estimates are a key performance indicator and everyday statistic used to inform earnings expectations of all oil and gas companies, or growth expectations of hydrocarbon basins or producing countries. It is stated in BOEPD (barrels of oil equivalent per day) and allows easy comparison with oil prices. Oil and gas companies routinely state their production totals on the first page of their financial reports.
Similarly, offshore wind and renewable energy-producing companies also state their electricity production in the headlines of their financial reports (normally using Annual Energy Production, or AEP, in units of GWh/yr, or gigawatt hours per year). But, unlike oil and gas, forward-looking estimates for companies or regions are presented in terms of “capacity” (using units of “GW”). For offshore wind, a project’s capacity is simply a factor of how many turbines a project is expected to utilize multiplied by the size of the turbine: 50 x 20MW turbines = 1GW capacity wind farm. However, this does not inform how much energy the project will produce or how much revenue it will generate. For this we need to talk about new and future offshore wind projects in terms of their AEP.
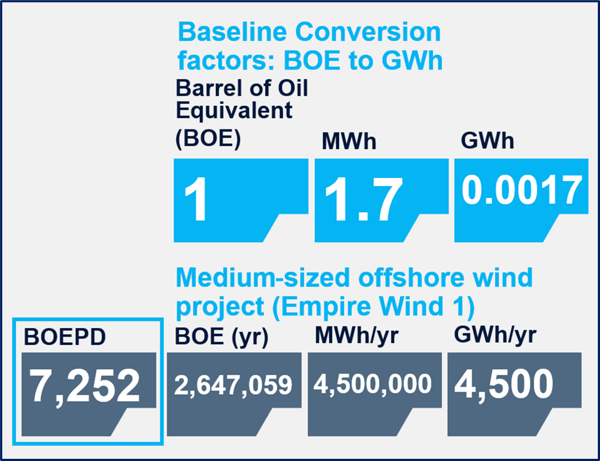
(Figure 1) Comparison between BOEPD and GWh using Equinor/BP’s Empire Wind 1 offshore wind project, south of New York.
Estimating AEP requires a complex multi-parameter methodology leveled on the long-term variation in windspeeds and datapoints on the specifics of an offshore wind project (turbine size and number, completion date, owner, and other market statistics) - all collected by 4C Offshore, TGS’ authoritative market intelligence service for offshore wind. Uniquely, due to the diverse resources in TGS’ renewables data ecosystem, we can query these parameters using the repeatable methodologies within Wind AXIOM. We have used these resources to estimate the production and growth of every confirmed project in the US offshore wind project pipeline.
Analysis Outcomes
When built out at the end of the 2030s, the offshore wind pipeline will produce more than 209,000 GWh of electricity each year, equivalent to 336,800 BOEPD (Figure 1), or enough to power 53M electric vehicles. This will take more than 15 years to build out at a peak rate of more than 1 turbine every day (Figure 2).
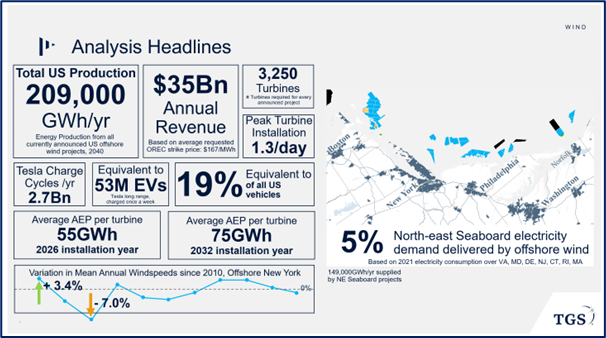
(Figure 2) Headline analysis from TGS’ review of offshore wind production in the US after the buildout of all currently awarded offshore wind projects. Yet-to-be-awarded future auctions not accounted for.
This energy will be delivered by only a small number of companies. Below, we plot a league table of lead operators responsible for the buildout (Figure 3) and a calendar of the expected delivery of these projects. Labels represent the wind farm’s AEP (Figure 4).
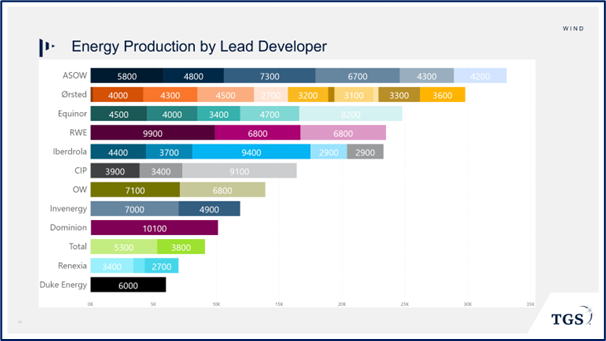
(Figure 3) Lead-Operator league table indicating the AEP of each operator once buildout of existing projects has been completed.
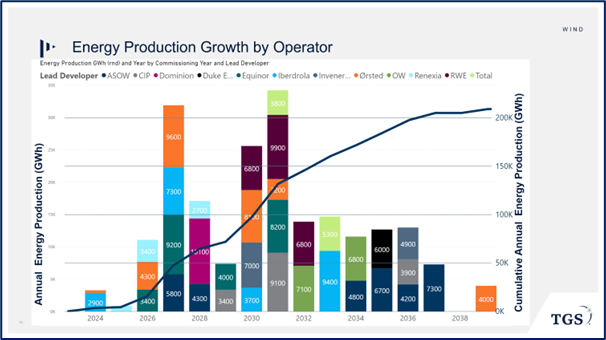
(Figure 4) Annual project completion and cumulative energy production growth for offshore wind, given analysis expectation of buildout in the US.
From here, each of these project’s AEP estimates can be multiplied by their agreed long-term energy credits. From a developer’s perspective, long-term energy credits are a key benefit to building offshore wind projects, as their production is not a risk to the fluctuation of market prices in the same way as oil price changes the impact on oil and gas projects.
Energy Credits and Understanding Offshore Wind Revenues
Except, today we have a problem. All the US offshore wind project pipelines that have secured historic energy credit agreements did so in a low inflation-low interest macro environment, and the changing cost of capital and equipment has resulted in some of these agreed credits being unviable. Some developers have submitted requests to renegotiate these positions; the average of the new requests is $167/MWh - a 40% increase. If every project secured a credit agreement at this price, the top five developers would generate annual incomes greater than $3Bn. However, New York State has refused to renegotiate, leaving projects such as our example at Empire Wind 1 with a real likelihood of not moving forward, or worse, left sitting on the lease area for a long period.
The latest news on this subject is significantly more promising, with offtake agreements for three offshore wind projects – Community Wind (RWE/National Grid), Attentive Energy One (TotalEnergies) and Excelsior Wind (Avangrid[Iberdrola]/CIP) – being approved by New York State at an weighted average strike price across all three projects of $145/MWh (in nominal USD), suggesting a medium ground has been recognized to allow future projects to move forwards. As the positions of all the offshore wind projects in the US evolve, their final prices will reveal a clearer picture of revenue and timeline for said project/developer/region.
TGS is uniquely positioned to react to this dynamic market and estimate AEP at national scales. If you would like to learn more about our market intelligence services for offshore wind, or the next phase of this analysis of AEP, please contact us.