Mapping Natural Gas Assets Positioned to Power AI Data Centers
The growth of AI investments and infrastructure represents a significant shift not only in the efficiency of the modern workforce, but also on the energy landscape of the US and the world. US electricity demand from data centers is expected to grow from 183 TWh in 2024 to over 426 TWh by 2030. Currently natural gas accounts for around 40% of electricity supplied to the US power grid, but new data center construction is experiencing political and logistical concerns around drawing power from the grid. New reports appear to frequently highlight how new data centers can spike electricity prices in regional markets, and new research suggests that power supply delays could add between 24 to 72 months to data center construction timelines. As a result, many new data centers are taking a “behind-the-meter” approach to power these data centers with their own on-site facilities, primarily relying on natural gas. When paired with carbon capture technology, by companies like Exxon, this presents a massive opportunity for additional exploration and development in natural gas fields while also maintaining carbon emissions targets. However, to meet this increased demand exclusively with natural gas, without disrupting existing natural gas flows, production will need to increase. Even assuming all flared gas, estimated at ~200 BCF in 2025, could be utilized, production would still need to increase by over 15 BCF/d.
While many analyses focus on aggregate data center electricity demand and the resulting need for new generation, far fewer tie that demand directly back to specific, producible gas volumes and nearby pipelines. By combining TGS well-level production data with Endeavor MAPSearch midstream infrastructure, we can pinpoint where proven and producing gas assets are already sitting near existing takeaway capacity, effectively revealing ‘shovelready’ locations for behind-the-meter power development. This proximity view is critical as AI-driven data centers push U.S. power demand to new highs and accelerate a wave of gasfired capacity aimed specifically at serving hyperscalers. Figures 1-3 show the geographic location of PDP reserves that are within reach of an existing natural gas pipeline or gathering line, PDP reserves that are not within reach, and flared gas. As of March 2026, there are approximately 250 TCF PDP reserves within 1 km of existing pipeline infrastructure, another 127 TCF PDP reserves more than 1 km from existing pipeline infrastructure, and at least 212 BCF of natural gas that was flared onsite in 2025. Using rough conversions, the easily accessible reserves would be enough to power a significant portion of the expected additional data center demand by 2030. Planning for new data centers to utilize these reserves could decrease operational costs, shorten construction timelines, and improve project economics. What differentiates this analysis is that it does not just quantify total PDP gas but shows how much of that gas is already effectively ‘data-center ready’ because it sits within 1 km of existing midstream infrastructure.
Key Take Away
Nearly two-thirds of the ~377 TCF of proved developed producing natural gas we map sits within just 1 km of existing pipeline or gathering infrastructure, making it uniquely positioned to support rapid, behind-the-meter power development for AI data centers.
Another key aspect of site planning for data center buildout is access to fresh water for cooling. Water scarcity and stress is another potential regulatory and political challenge, so identifying sites with plentiful water availability will be a key requirement. Figure 4 shows the geographic location of pre-operational facilities with regional baseline water stress levels. Overlaying this water stress map with the PDP natural gas reserves (Figure 5) shows some potential opportunities for site planning.
As AI-driven power demand accelerates, the most competitive data center projects will be those that can quickly secure low-cost, reliable fuel with minimal new infrastructure. By connecting proved developed gas volumes, pipeline proximity, and water availability, our analysis highlights where that advantage already exists in the subsurface and midstream grid.
TGS’ integrated subsurface and infrastructure datasets enable developers, operators, and hyperscalers to move beyond generic demand forecasts and into concrete site screening, timeline optimization, and risk reduction. In an upcoming article, we will dive into the Utica play, illustrating how this framework translates into specific locations, volumes, and timelines for AI-ready power.
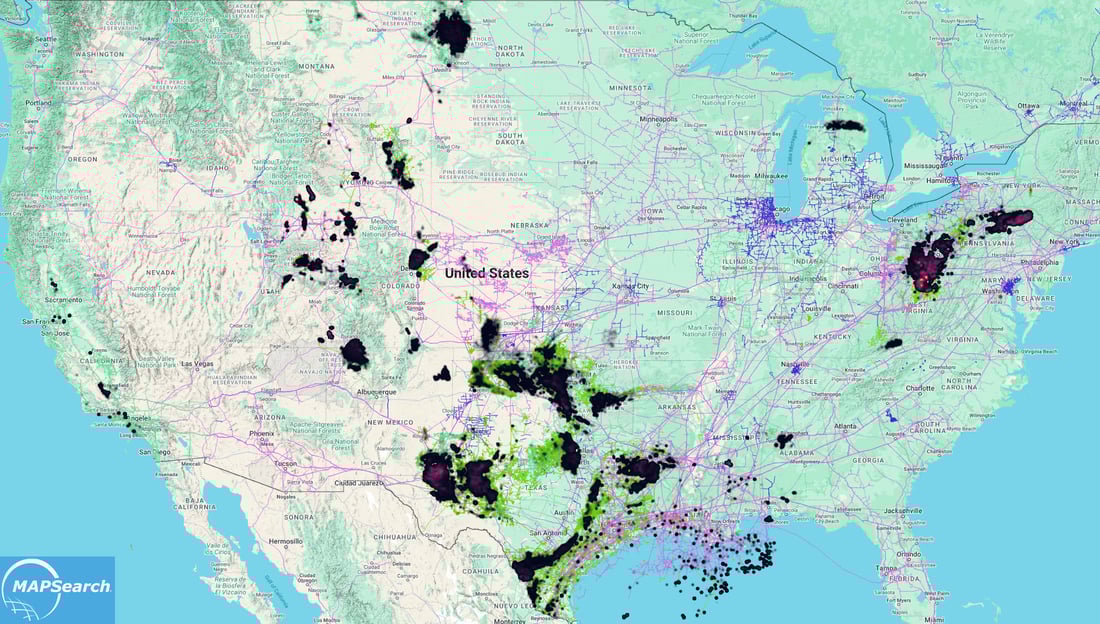
Figure 1. PDP reserves within 1 km of pipelines - Proved developed gas volumes located within 1 km of existing pipelines and gathering lines.
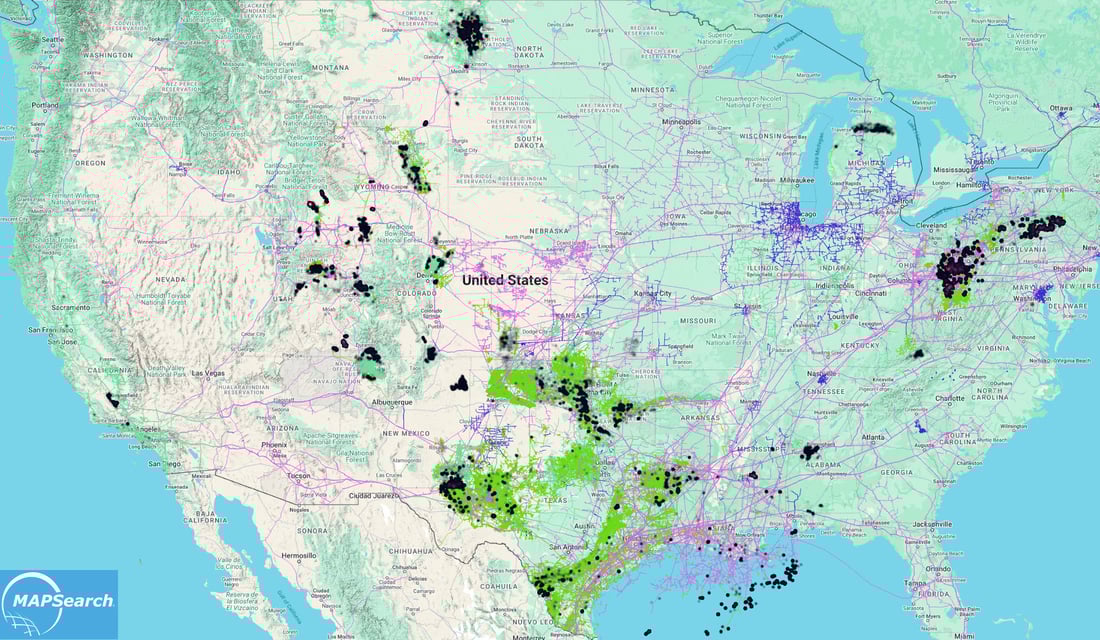
Figure 2. PDP reserves beyond 1 km - PDP gas reserves more than 1 km from existing midstream infrastructure.
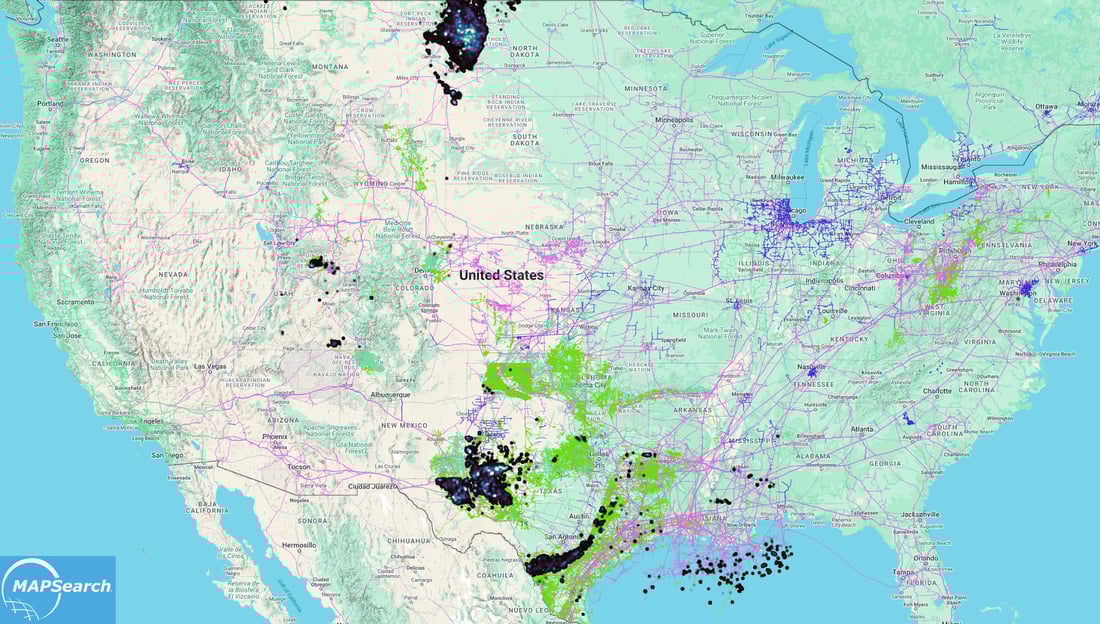
Figure 3. Locations and volumes of natural gas flared at well sites in 2025.
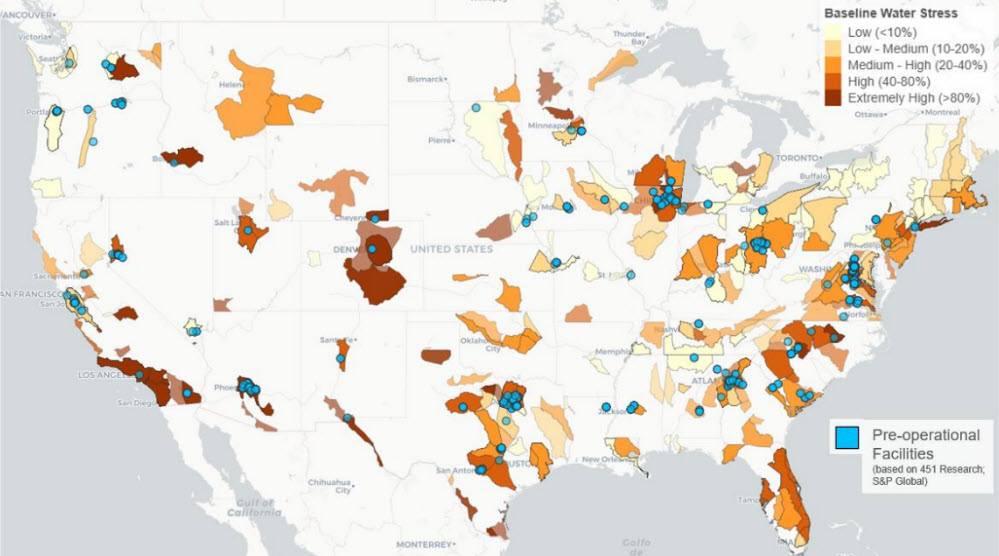
Figure 4. Baseline Water Stress Overlaid with Pre-operational Data Center Facilities. Source: Hiatt and Ryu – “Data Center Energy Demand: Who, Where, and How Growth is Emerging”
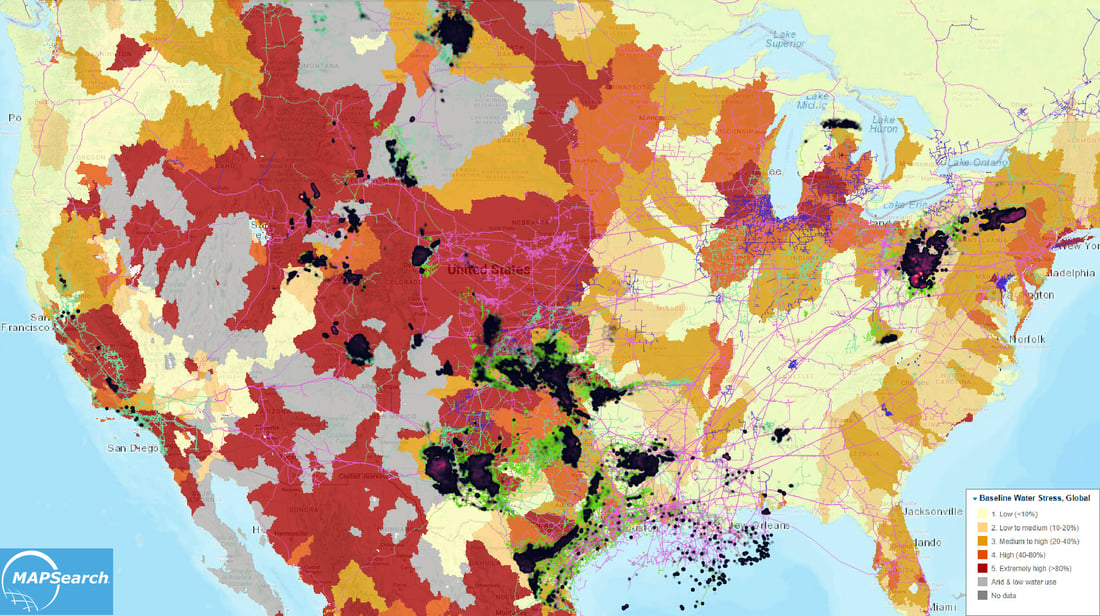
Figure 5. PDP reserves within 1 km of pipelines, overlayed with Baseline Water Stress Source: DataBasin
For more information about TGS Well and Production Data please contact us at WDPSales@tgs.com.