A certain amount of volatility is baked into the oil industry; boom and bust cycles are to be expected when investing in this sector. However, the confluence of events that have occurred in the first quarter of 2020, and the ensuing effect on the markets in general and oil prices specifically, are sure to have shocked even the most conservative market watchers. This downturn is certain to wreak havoc on the US shale sector, but operators who are able to weather the storm and invest wisely through the volatility stand to gain a substantial advantage as we settle into the new economic environment. This analysis will look at the potential hydrocarbon production and costs of development of 4 major Texas oil plays within an economic framework. We will look at wells drilled and produced within the last 5 years from each of these plays using pre-calculated performance statistics, unconventional completions attributes, and allocated well level production volumes including produced water from the TGS Well Performance Database.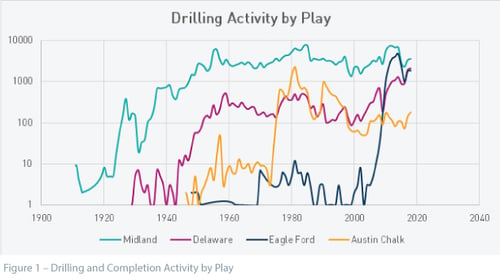
Texas has long been the behemoth of oil production in the onshore US. The Permian basin in West Texas, specifically the Delaware and Midland sub-basins, have remained the some of the most active oil plays throughout recent history. But there have also been significant trends towards other Texas hydrocarbon plays during different periods (Figure 1). The 1970’s and early 80’s saw a move towards drilling and producing out of the Austin Chalk, and increases in unconventional completion methods led to the shale boom in the late 2000’s and 2010’s which paved the way for major exploitation of the Eagle Ford trend.
Various technical and economic conditions have helped shape how and where oil and gas wells have historically been drilled and produced. And now a new environment of technical and economic conditions is forming that will shape the near future of the Texas oil industry. Vast improvements in well planning, drilling, and completion designs have led to highly productive wells and well systems. At the same time, a glut of production and geopolitical price war have cooled prices down to beyond unsustainable lows, paired with the rising capital expenditures of these new and improved drilling and completion techniques. Now, more than ever, the balance between maximizing production and minimizing costs means the difference between success and failure.
This analysis looks at recently drilled wells from the last 5 years in 4 major Texas plays, using criteria to select wells based on the start of production and the basin or formation identifying the play. Wells were restricted to only those that had a calculated first production date of 2015 or later and were then grouped into plays based on either Basin or Formation definition. Then, only the top 20% of wells in each play were selected, using TGS’ allocated production and MaxOilPlus2 statistic (90-day oil IP). This final subset of wells was used to calculate type curves and aggregate CAPEX attributes.
The economic analysis was conducted using inputs from the TGS completions attributes to estimate drilling and completion costs, as well as allocated water production and estimated lease operating expenses. This study was forecasted over a 30-year time horizon, calculating NPV and other key economic indicators based on a range of interest rates. Cost estimates were derived from industry publications and operator financial reports, and sales rates were set at pre-slump levels, on the assumption that geopolitical price wars will eventually subside, and market forces will equilibrate.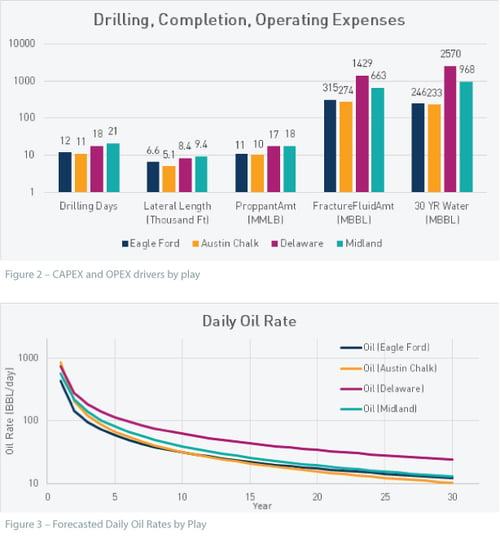
Figure 2 details the main attributes that were used to derive drilling, completion, and operating estimates, broken down by play. Drilling days, proppant amount, and fracture fluid amounts were the main drivers of capital expenditures at time 0, while produced water was a main driver of operating costs over the life of the well. As expected, the Permian Basin wells trend towards higher drilling and completions costs, while also producing the highest volume of water. Eagle Ford and Austin Chalk wells tend to be drilled quicker, shallower, and with less hydraulic fracturing costs, while crucially also producing much less water.
Figure 3 details the oil type curve for each play, calculated using Arps hyperbolic decline curve fit methodology. The B-factors were defined using industry research and public operator reports, while other Arp’s coefficients were calculated (within standard boundary constraints) based on observed production histories. In this dataset the Austin Chalk wells tend to produce with the highest IP and initial decline rates, causing them to quickly drop off in production in favor of the Delaware and Midland wells with slightly lower initial declines. Meanwhile, the Eagle Ford wells initially produce with a lower IP but maintain a relatively lower decline throughout the 30-year life of the well.
Finally, Figure 4 shows the cumulative NPV10 for each of the 4 play models. The Midland and Delaware models start off with much higher CAPEX, but quickly overtake the less capital-intensive Eagle Ford model with higher production rates. In contrast, the less resource intensive and initially highly productive Austin Chalk model translates into a significantly higher NPV than the other plays, despite the quick drop off in production. As the PV interest rate increases (Table 1) this discrepancy only becomes more significant.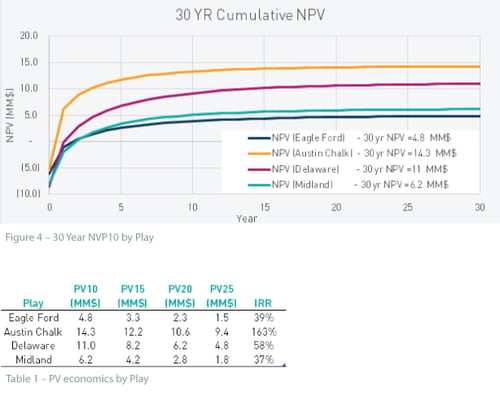
Before drawing conclusions from the data there are other facts and assumptions not contained within the model that should be considered. Oil and gas sales prices and water disposal costs were considered static for this analysis, but volatility in the price of oil or the cost of water disposal could lead to significant swings in profitability. As water continues to be produced in high volumes, water disposal costs will continue to rise, leading to much higher long-term operating expenses for plays with higher water production. It’s also worth considering the value of investing in stacked target plays versus single target plays. Drilling a well in the Permian with the intent of developing multiple targets, sharing some of the capital expenditures between the targets, could help offset the high initial cost when compared to single target plays like the Eagle Ford and Austin Chalk.
The quantity and quality of acreage available for each of these plays is also worth further consideration. As mentioned earlier, the Permian has been exploited over a long period of time. The highest quality areas of the basin have already been extensively developed, leaving very little quality acreage available for new development, which is reflected both in this study and in consideration for future investment. While prime Eagle Ford acreage is also mostly played out, the Austin Chalk play is spread out over a much wider area, meaning there’s potentially still room to identify and develop high quality acreage. Although the selection bias described above does present itself in this analysis, this is the current state of the hydrocarbon environment, and is the framework in which investment decisions should be understood. As the oil price slump drags on, operators will need to consider their asset production profiles in relation to capital and operating costs when determining how to manage current and future assets.