In the ever-evolving landscape of the oil and gas industry, the echoes of transformative change resound through the recent surge in merger and acquisition activity. Since October 2023, the sector has witnessed a seismic shift with notable transactions, including the groundbreaking ExxonMobil Pioneer deal, the strategic maneuvers of Chevron Hess, and the dynamic synergy of OXY CrownRock. These mega-mergers underscore the industry's resilience in adapting to market conditions and will influence the scalability of U.S. hydrocarbon production, particularly from unconventional sources.
This paper analyzes the recently announced transactions and demonstrates how the new addition of Well Economics Data within TGS Well Data Analytics can aid companies in creating a smooth workflow for asset valuation analysis and investment decision-making. Both are instrumental in the Merger and Acquisitions (M&A) process.
The asset valuation process in the oil and gas industry is inherently challenging due to the complexity of geological formations, varying reservoir characteristics, and the dynamic nature of commodity prices. Assessing the actual value of unconventional resources demands a thorough understanding of technical, financial, and market factors (Figure 1). TGS, with its comprehensive Well Data Analytics solution and subsurface library, addresses these challenges by providing a wealth of information on reservoir properties, production trends, geological insights, and economic scenarios (Figures 1, 2). TGS empowers oil and gas professionals with the tools needed to navigate the intricacies of asset valuation, ultimately facilitating informed investment decisions and strategic planning. For example, by leveraging TGS data and asset valuation workflows, TGS estimates a transaction value for the ExxonMobil Pioneer deal ranging between $53 to $61 bn, with ~1,300 undeveloped locations.
Transactions Highlights:
- Combined deal value of ~$125 bn for the three transactions.
- All three buyers are public companies.
- Two of the three acquired companies were also public companies.
- Two of the three acquisitions’ main geographic areas are in the Midland Basin (Permian).
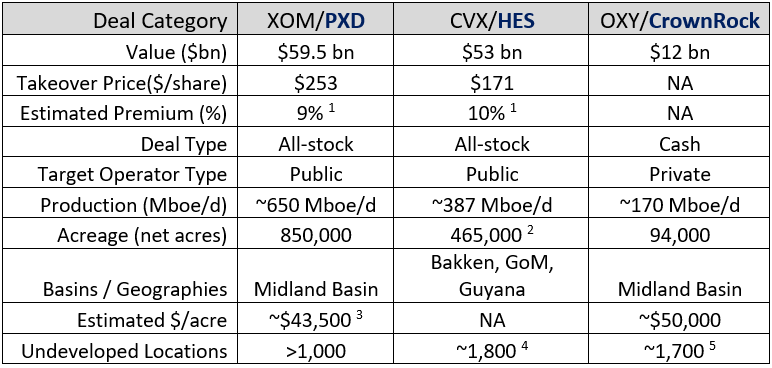
Table 1: Deal Summary Table. The companies bolded in blue were the acquired (target) companies.
XOM: ExxonMobil, PXD: Pioneer, CVX: Chevron, HES: HESS, OXY: Occidental.
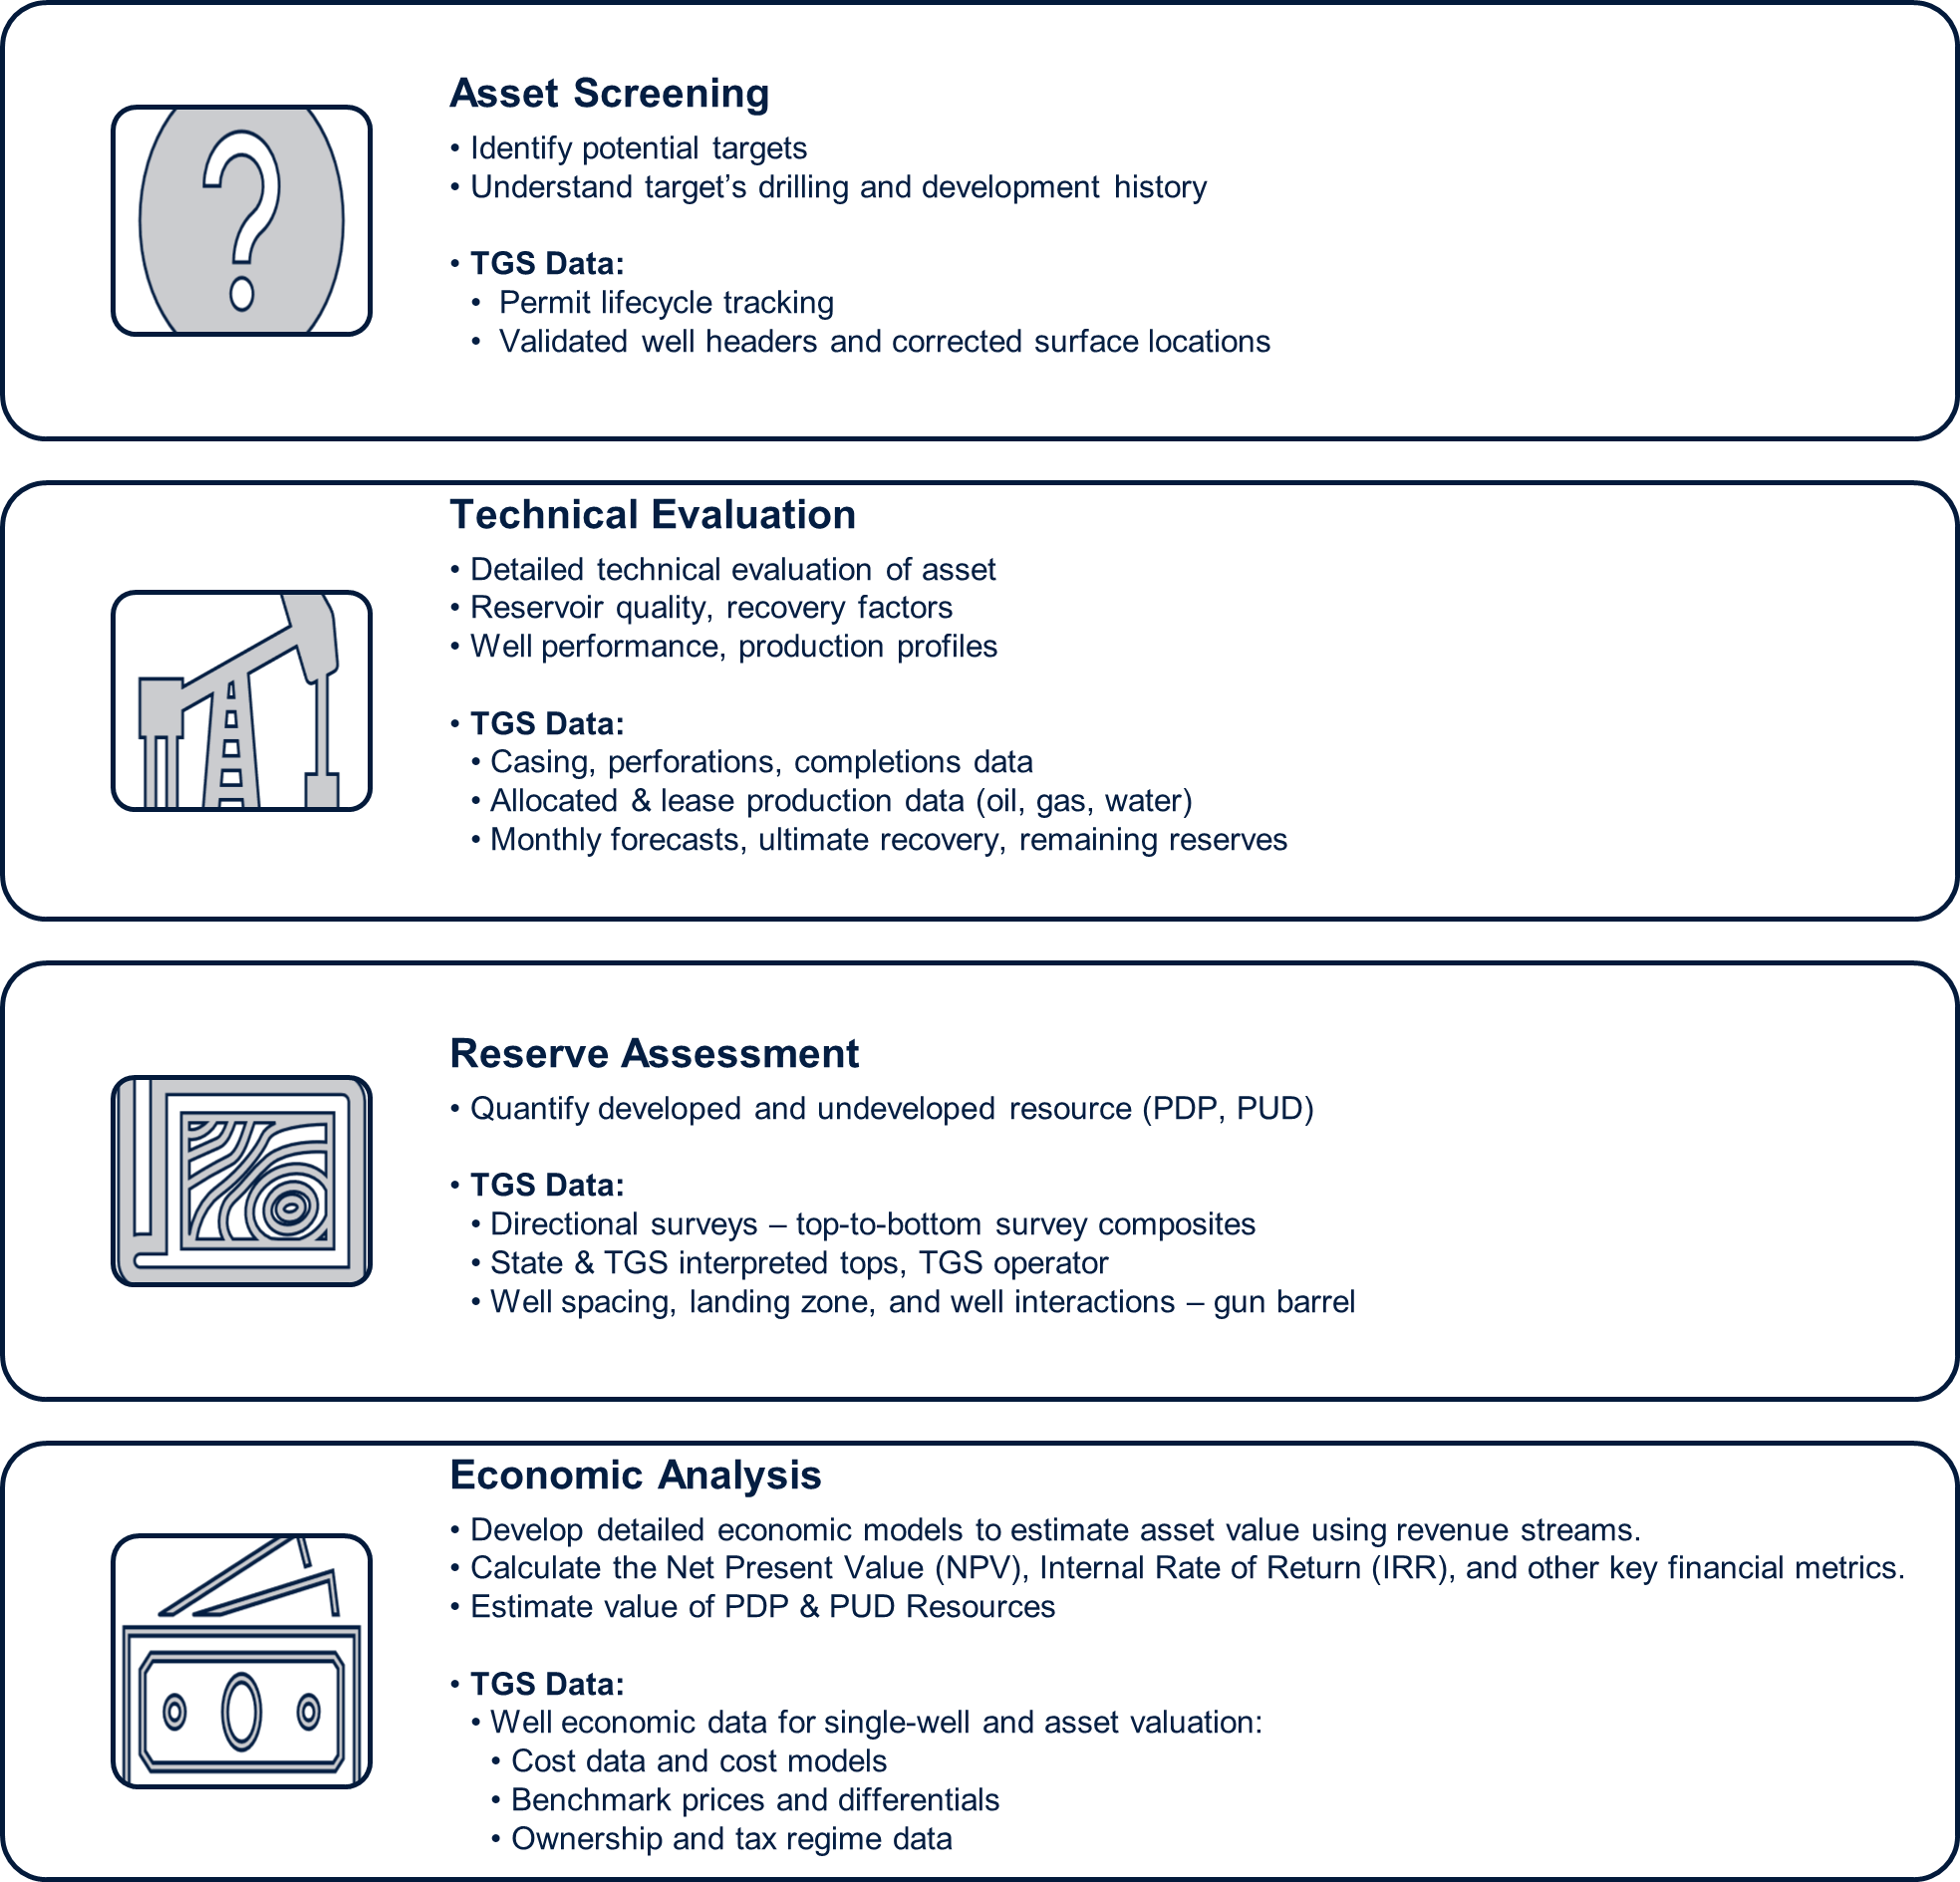
Figure 1: High-level asset valuation process illustrating which TGS data can be used to evaluate each phase.
.png)
Figure 2: Well Data Analytics dashboard showcasing Well Economics Data on the left, Pioneer’s developed and undeveloped acreage on the map, and reservoir properties, production trends, and geological insights on the right.
Pioneer’s Case Study Analysis
The purpose of the case study is to demonstrate how Well Economics Data within TGS Well Data Analytics (WDA) can assist companies in conducting accurate and fast company and inventory valuation analysis.
The study includes ~9,000 Pioneer wells encountered in the Midland Basin (Figure 3). Pioneer has been an active operator in the basin since the early 2000s, maintaining a consistent drilling development campaign even during years of downturn. In the decade of 2000 to 2010, the company drilled a total of 2,429 vertical wells. In the following decade, from 2011 to 2020, the company’s drilling strategy shifted to horizontal drilling, increasing from less than 5% horizontal wells in 2012 to over 88% in 2020, drilling a total of 5,031 wells. Since 2021, the company has almost exclusively drilled horizontal wells, completing 1,446 wells (Figure 4).
Once Pioneer switched to horizontal drilling, the company quickly increased the average lateral length year over year. It transitioned from 1-mile laterals in the years 2012 to 2015 to drilling >2-mile laterals in 2023 (Figure 5). Pioneer drilled ~200 wells in 2023 with lateral lengths greater than 14,000 ft, according to TGS WDA data. The company stated several times during 2023 that increasing lateral length strengthens returns by reducing the capital spending needed per well by ~15% and achieving higher economic returns. Exxon attributes one-third of the potential synergies of the transaction (~$700 million) to materialize mainly from capital efficiencies by drilling longer laterals.
TGS published a spotlight article analyzing lateral length and its impact on economic results in Q4-2023. The study showed that the internal rate of return increases by ~720 basis points, and the net present value improves by ~$3.5 million for a 3-mile lateral well compared to a 2-mile lateral well under the base case price scenario at $80/bbl and $3.5/mcf. To learn more about this analysis, click on the following link.
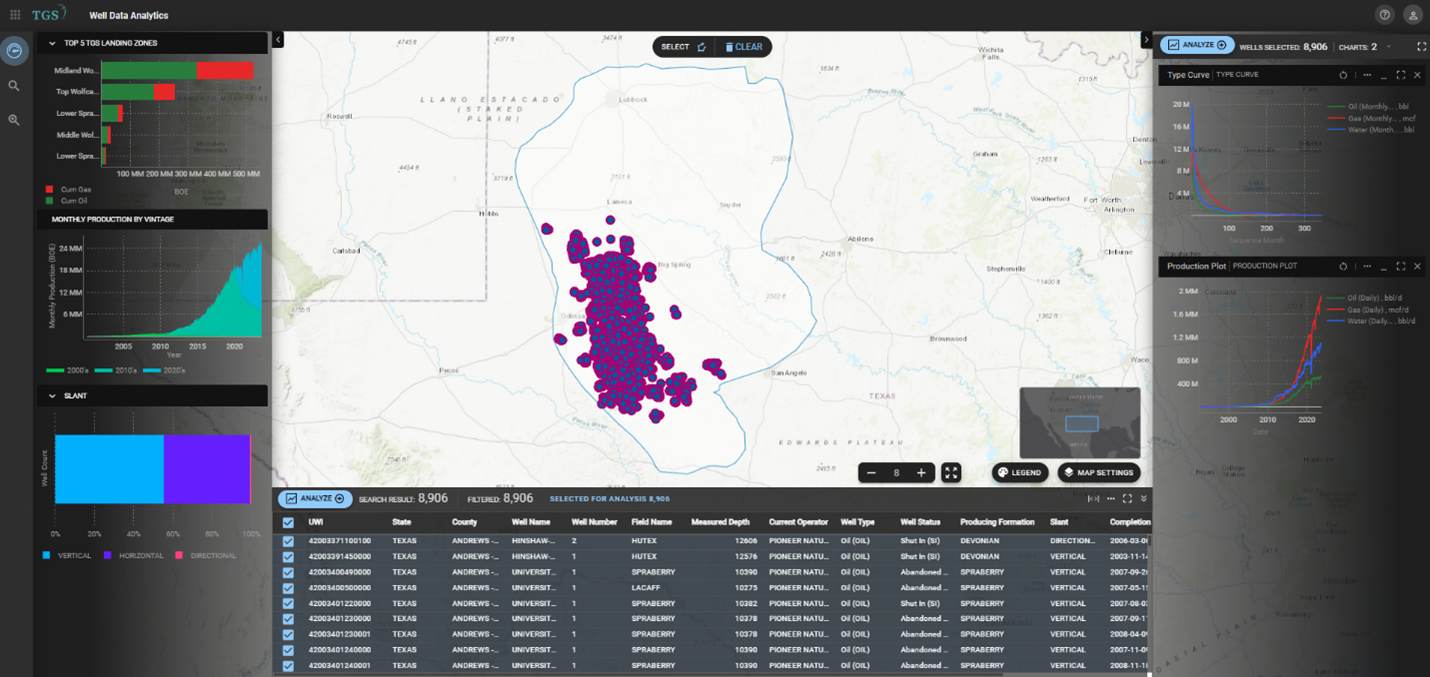
Figure 3: Study area includes ~9,000 Pioneer wells – image taken from TGS Well Data Analytics (WDA). The top 5 producing formations, monthly production by vintage, and well-count by slant plots are on the left. A map of Pioneer wellbores in the Midland Basin is in the middle and type curve and production plots are on the right of the dashboard.
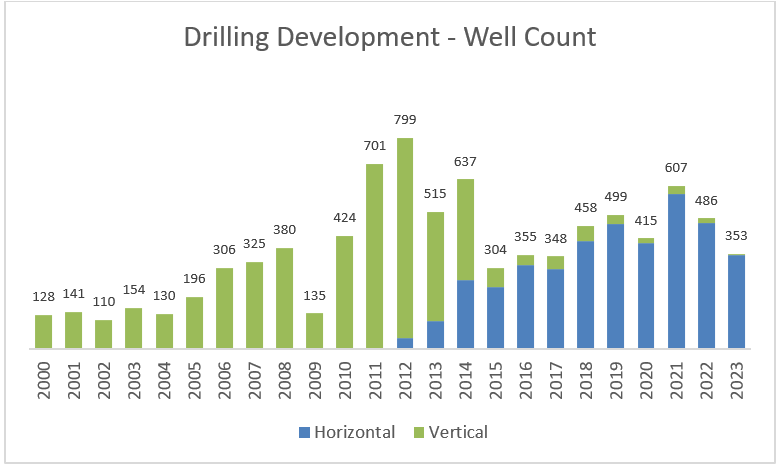
Figure 4: Pioneer’s drilling development analysis from 2000 to 2023 using TGS WDA data.
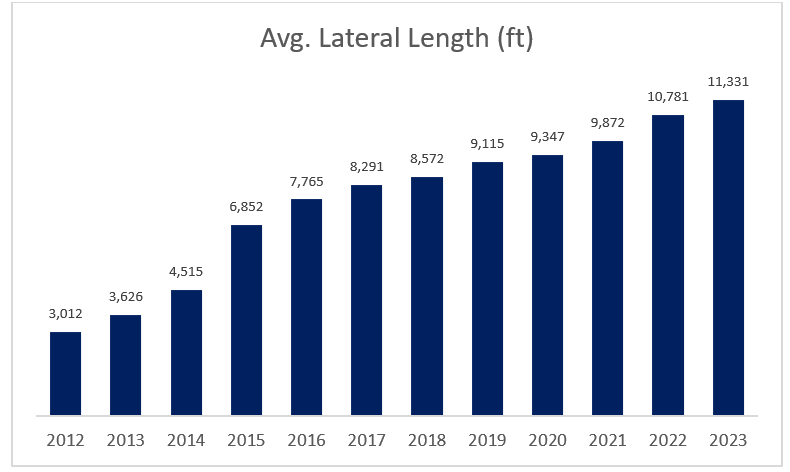
Figure 5: Pioneer’s average lateral length evolution from 2012 to 2023 using TGS WDA data.
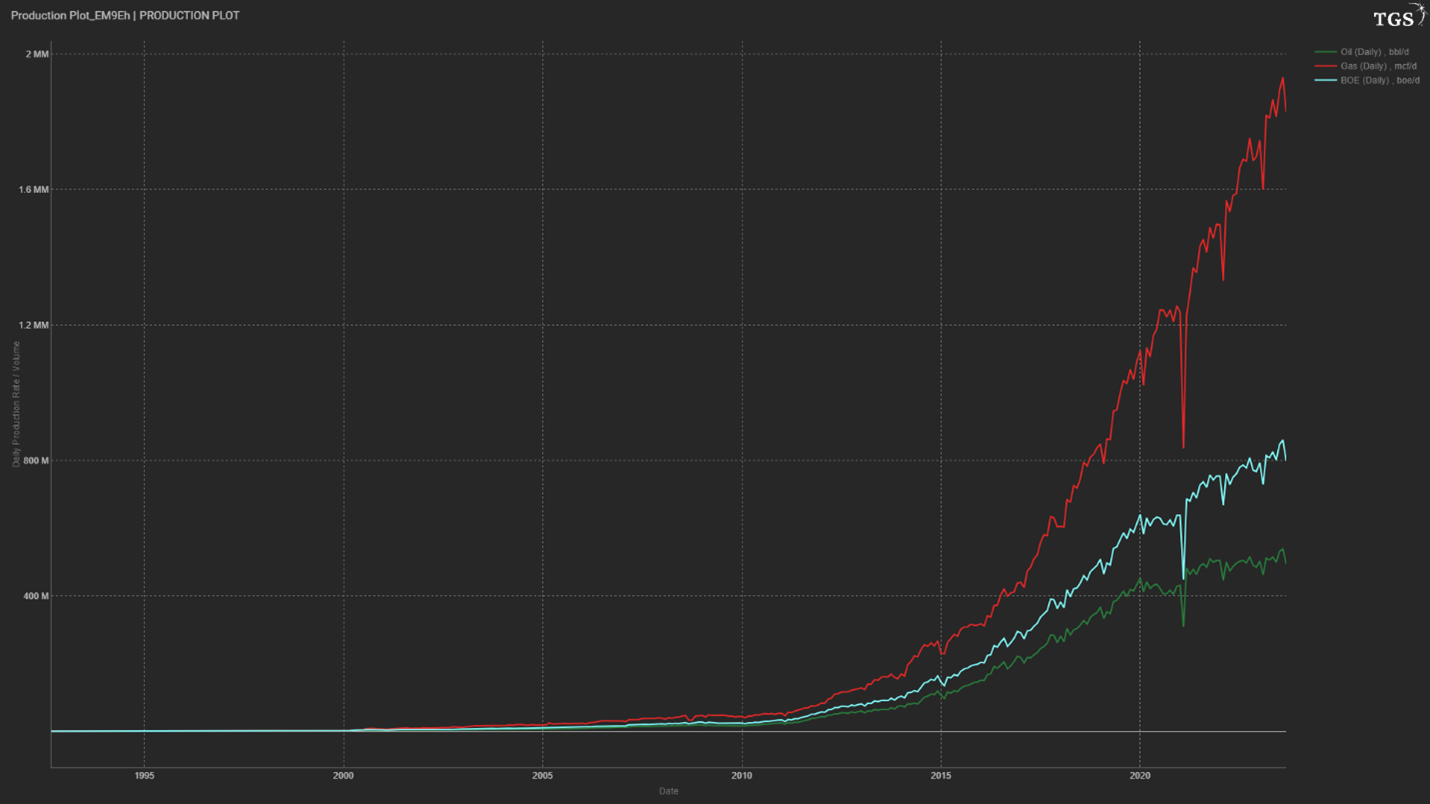
Figure 6: Daily production plot for Pioneer over time showing oil in green, gas in red, and
equivalent production (BOE) in light blue taken from TGS WDA.
According to TGS’s allocated production, Pioneer produced 493 Mbo/d of oil, 1.8 Bcf/d of gas, and equivalent production of ~800 Mboe/d as of September 2023 (Figure 6). Considering the company’s reported working interest of ~88%, TGS estimates the company’s net equivalent production to be ~700 Mboe/d. In Midland, recent production deal multiples range between $40,000/boe to ~45,000/boe. Therefore, TGS calculates the total transaction value attributed to Proved Developed Producing Resources (PDP) to be between $28 bn and $32 bn by multiplying the net production volumes by the production multiple ranges.
TGS WDA can assist in assessing the number of undeveloped locations when the value is unknown or when a company needs to analyze a new area for development. In this case, the gun barrel feature can be utilized to understand how many wells per section (WPS) are drilled per unit and how many wells could be drilled in undeveloped acreage position in future development.
According to the gun barrel diagram from one of Pioneer’s recent pads, the company is drilling using a Cube development strategy, spacing wells by ~800-900 ft horizontally in the lower Spraberry shale, the primary producing formation (Figure 7, 8). This translates into placing ~6 to 7 wells in a single drilling unit. The gun barrel diagram also shows the company drilling multiple benches, creating a multi-zone development strategy. However, for a 3-mile lateral well, unitization agreements will have to be worked out to allow a large amount of acreage to be joined together via contracts or statute to develop the reservoir this way.
To estimate Pioneer’s developed and undeveloped resources, the company's acreage position was digitized and uploaded to WDA (Figure 9). A total of ~1,035,615 gross acres were calculated in the process. Directional drilling data was utilized to determine developed acres, estimating ~464,124 gross acres. As a result, TGS estimates a total of ~571,492 gross undeveloped acres. Using 6 to 7 WPS for well spacing per drilling unit and a safety buffer of ~330 ft from leasing lines as required by the state, TGS approximates there to be ~2,232 gross undeveloped locations for 10,000 ft laterals and ~1,488 gross undeveloped locations for 15,000 ft laterals. The estimated gross locations can be netted down by applying the company’s average working interest in the basin, which is reported to be ~88%. Therefore, TGS calculates ~1,300 net undeveloped locations for 15,000 ft lateral wells.
.png)
Figure 7: Gun barrel diagram for a 2023 Pioneer well using TGS WDA displaying the vertical and
horizontal distance to a nearby sibling well in the same producing formation.
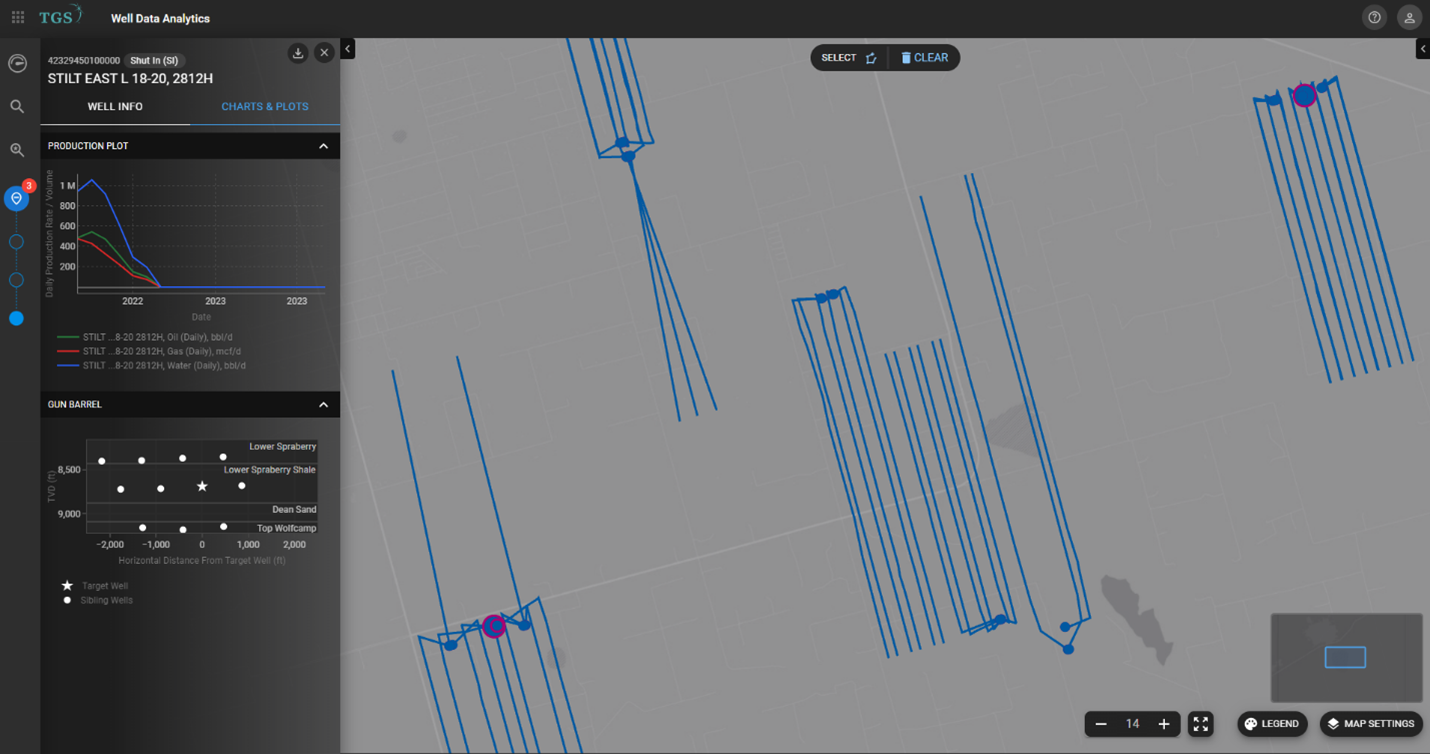
Figure 8: Well Spacing Analysis Dashboard – image taken from TGS Well Data Analytics (WDA). The map shows an area of recent well development for Pioneer. The production plot and gun barrel diagram are displayed on the left of the dashboard.
-1.png?width=546&height=706&name=MicrosoftTeams-image%20(4)-1.png)
Figure 9: Map extract from TGS WDA including digitized Pioneer acreage position. TGS estimated developed acres are highlighted in yellow, whereas undeveloped acres are highlighted in light green.
Once the number of undeveloped locations is calculated, the next step involves determining an appropriate type curve that represents Pioneer’s most up-to-date production performance in the study area, as type curves form the foundation of the reserve and development planning analysis. Figure 10 displays a recent 3-mile well with current and forecasted production values that can serve as a type well for the area. Once the type well is established, the final step of the process consists of running an economic model to determine important economic outputs such as Internal Rate of Return (IRR), Net Present Value (NPV), Breakeven Price (BE), and Payback Period. These outputs are essential for estimating the dollar amount that could potentially be generated from developing the remaining inventory.
The newly launched TGS Well Economics Data within TGS Well Data Analytics allows users to quickly and accurately estimate those outputs (Figures 11 & 12). It also provides an economic deliverable that users can leverage to initiate their own internal financial model for more detailed asset valuation and analysis (Figure 13).
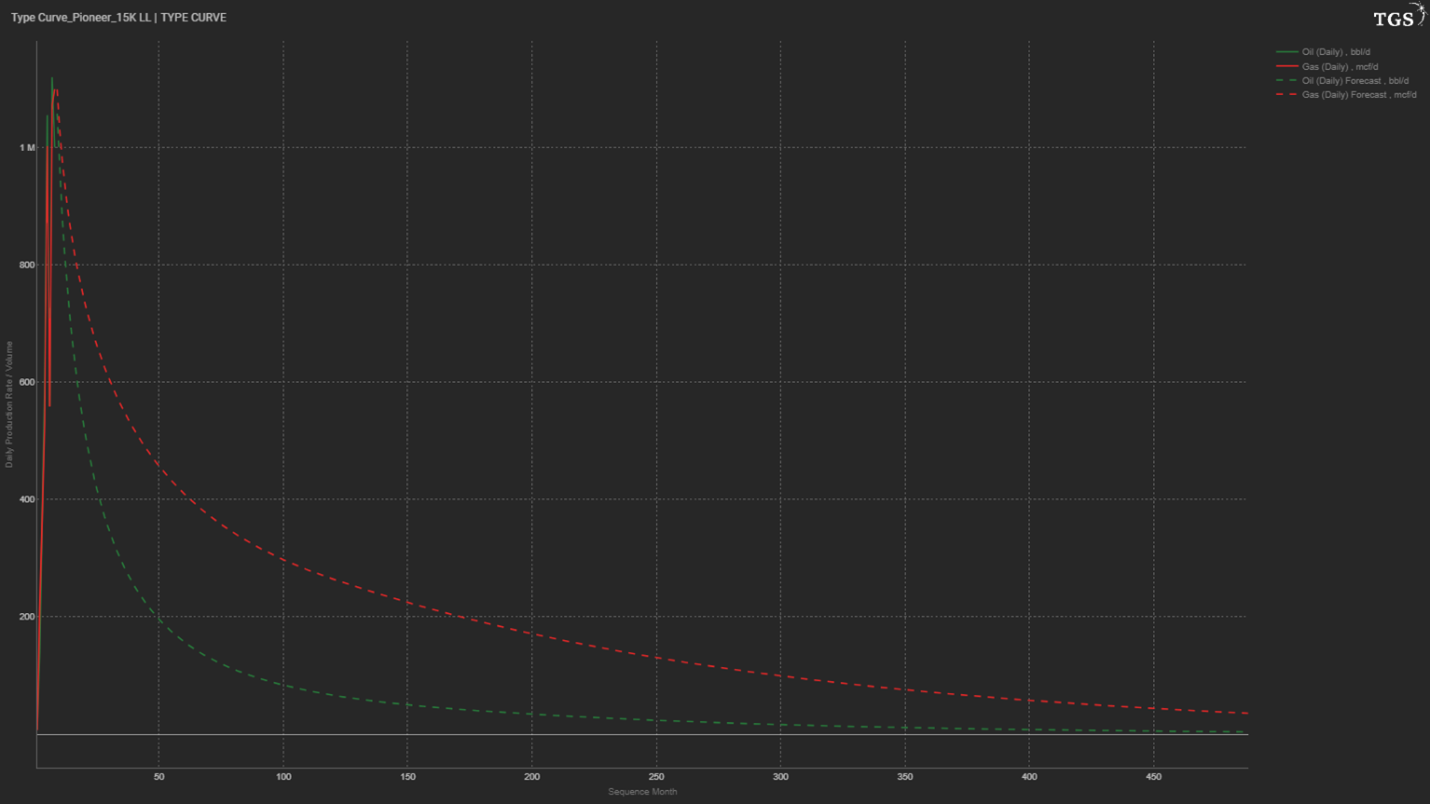
Figure 10: Type well for a recent 3-mile Pioneer well in the study area showing oil type curve
in green and gas type curve in red.
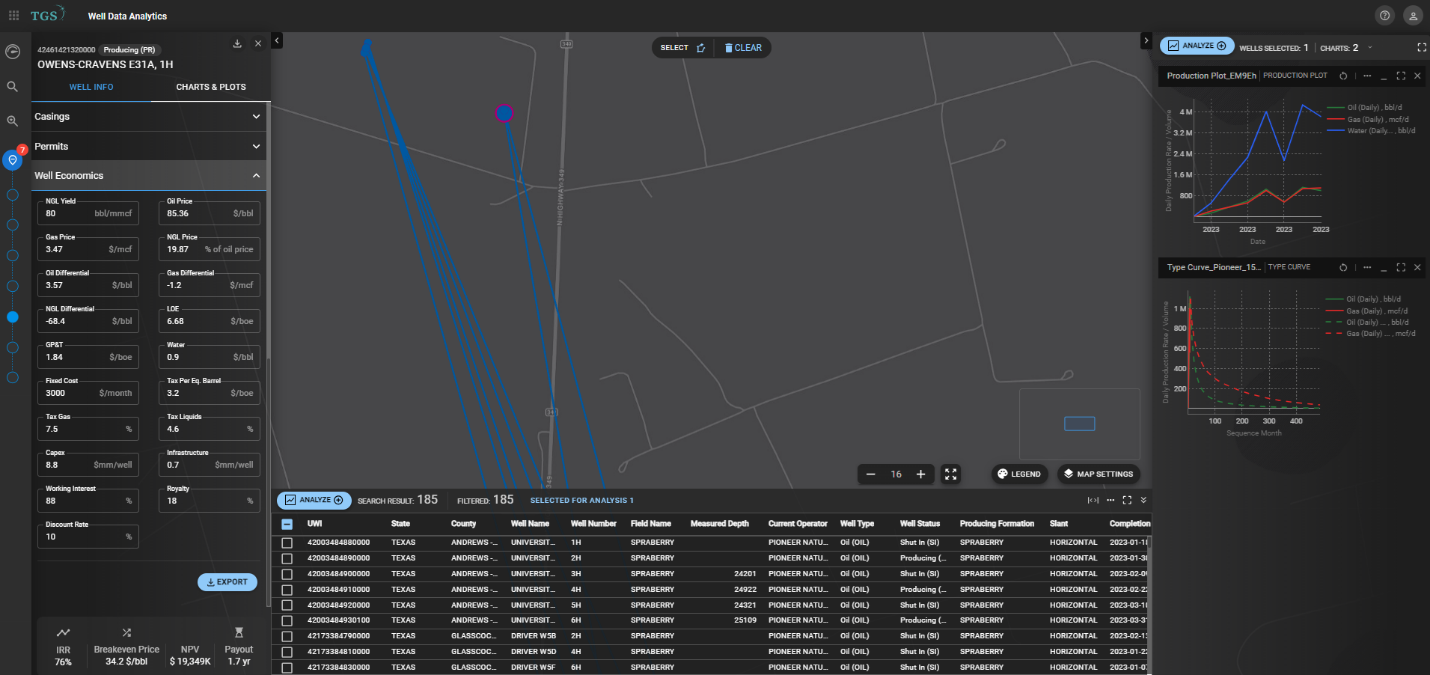
Figure 11: The Well Economics panel on the left shows economic inputs on top and main economic outputs on the bottom. Clients can customize economic inputs to recalculate the economic model.
.png)
Figure 12: Well Economics panel close-up image.
%20(1).png)
Figure 13: Well Economics Data deliverable in Excel.
As per TGS Well Economics Data, a type well in the study area for Pioneer generates an NPV between $19.2 million and $22.4 million2 and has breakeven prices ranging from $36.3/bbl to $41.2/bbl. Therefore, TGS estimates that the undeveloped resource can be valued between $25 bn to $29 bn, based on the estimated number of undeveloped locations (~1,300).
The table below summarizes the main deal attributes calculated using TGS Well Data Analytics, compared to the values that were reported by Exxon during the press release of the transaction. It demonstrates that TGS Well Economics Data and Well Data Analytics workflows can be applied to generate high-level accurate asset and company valuation metrics.
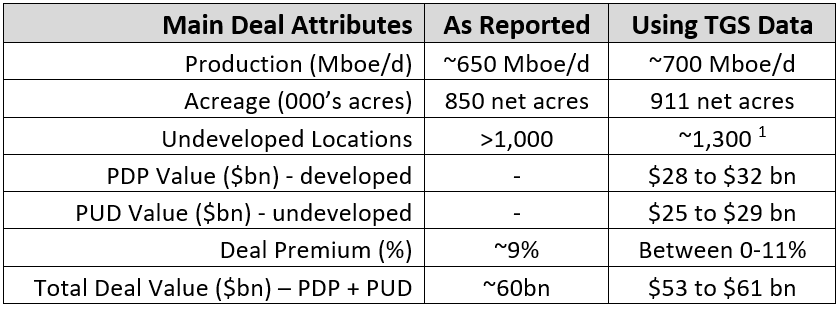
Table 2 : Main Deal Summary: Comparing transaction values as reported and estimated values using
TGS Well Data Analytics Data and Workflows.
The last eighteen months have been transformative in the oil and gas industry, particularly in terms of consolidation, especially for the US onshore market. This article summarized the three largest acquisitions from this period and conducts an in-depth case study on the ExxonMobil/ Pioneer deal. Utilizing the recently released TGS Well Economics Data, alongside well and production data, well spacing data, type curves, and visualizations from TGS Well Data Analytics, we predict an estimated value of $28 to $32 bn for the producing resource and $25 to $29 bn for the undeveloped resource, confirming the deal value of this acquisition purely on a cash flow analysis basis. This case study demonstrates how TGS Well Data Analytics, coupled with Well Economics Data, can streamline complex asset and company valuation processes across a wide range of scenarios.
Article References
Table 1:
1 Calculated over the firm’s 30-day volume-weighted average price.
2 Acreage located in the Bakken Basin.
3 TGS interpretation using $35,000/boe production multiple.
4 Sourced from JP Morgan Energy, Power & Renewables conference, June 2023.
5 ~1,250 locations ready to be developed as disclosed during the transaction.
Table 2:
1 Calculated for 15,000 ft lateral wells.
2 NPV values calculated with pre-generated TGS economic assumptions in the study area, with an average price of $60.0/bbl for oil, $4.4/mcf for gas and $12/bbl for NGL volumes. Two main type curve areas were identified and analyzed in the study: the north area and the south area of Pioneer’s acreage position.