This year marks the 100-year anniversary of commercial field development in the Permian Basin with the successful discovery of Santa Rita No. 1 in May 1923. Then, in the early 2000’s a new technological discovery, unconventional drilling and completions, or fracking, was operationalized in the Permian and allowed for extraction from previously unavailable reservoirs. While new unconventional wells could return orders of magnitude higher hydrocarbon volumes, they also proved much more costly to drill and complete, where wells with over 10,000-foot laterals could cost upwards of $10 million in CAPEX. Although these new unconventional reservoir targets were typically well-explored from a regional perspective, unconventional well performance still varies widely based on localized changes in individual landing zone thickness, stress orientation, and reservoir geomechanical properties.
High-resolution 3D seismic has proven to be critical for both conventional and unconventional development. For conventional assets, it ensures precise definition of drilling targets to optimally produce the structure. For unconventional reservoirs, sophisticated seismic processing can help geologists evaluate rock property volumes such as porosity, lithology, and TOC; seismic inversion can yield insights into reservoir geomechanical properties to guide completion engineers on optimal completion designs; and high-resolution 3D stratigraphy can be used to avoid drilling hazards and target landing zones with higher precision. In this article, we will use TGS Well Data Analytics and TGS economic analysis to shed additional light on the development strategies based on 3D seismic and the improved returns seismic data enables.
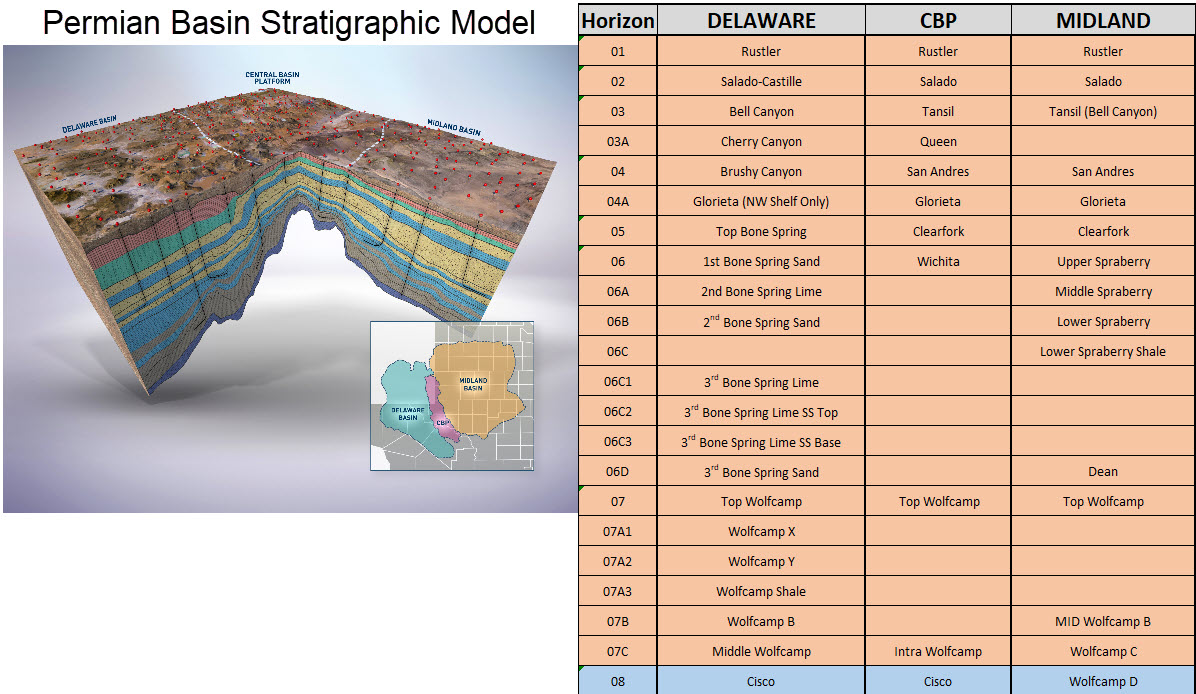
In 2017 and 2018, TGS acquired and processed the West Lindsey and West Kermit 3D seismic surveys in the center of the Delaware Basin to assist operators with the development of Wolfcamp and Bone Spring stacked play targets (Figure 1). The West Kermit 3D survey was acquired in late October 2017, covers 407 square miles in the heart of the Wolfcamp trend, and straddles the deep Delaware Basin and the structurally complex margin of the Central Basin Platform. This was followed shortly by the West Lindsey 3D survey, acquired in early 2018 and covering 178 square miles along the southwest Delaware Wolfcamp trend, which is cut through by the Grisham Fault and images significant structures along the western margin of the basin.
At the time of acquisition, the resource base had already been proven by an extensive history of conventional and unconventional production. Horizontal wells had primarily targeted the lower end of the Wolfcamp column (“Wolfcamp Shale”, “Wolfcamp B” and “Wolfcamp C”). In order to further delineate the column, focused imaging and high-resolution 3D seismic was required and operators updated their drilling programs. The TGS surveys allowed operators to confidently target additional zones further up in the column, such as the Wolfcamp X and Wolfcamp Y.
The study areas cover large portions of East Texas’ Loving, Reeves, Ward, and Winkler Counties. This area has supported oil and gas production since the 1930s, with conventional production peaking in 1975. But like many other Permian plays, shale production revolutionized productive output starting in the early 2010s (Figure 2). The vast majority of production from this area comes from Wolfcampian-age reservoirs, with the Wolfcamp Shale, Wolfcamp B, Wolfcamp X, Wolfcamp A, and Wolfcamp Y landing zones leading the way (Figure 3).
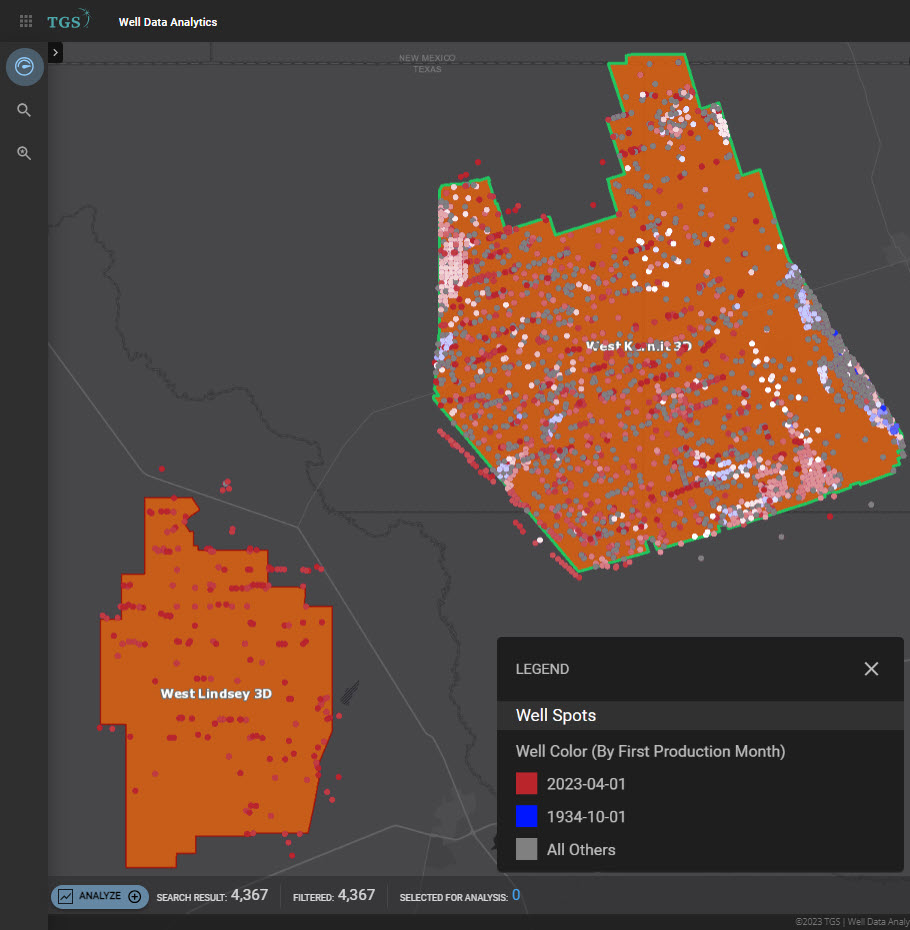
Figure 1 - Study Area
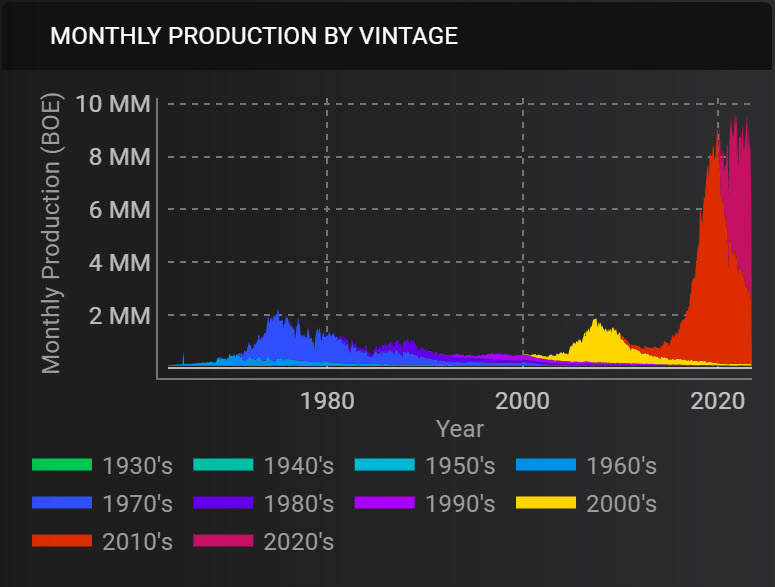
Figure 2 - Production by Vintage
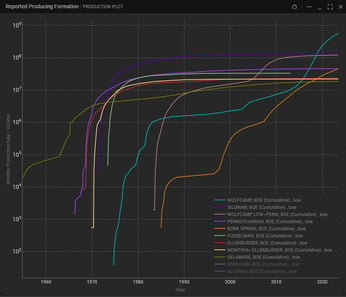
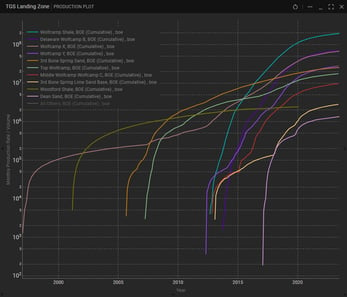
Figure 3 – Cumulative Production by Reported Formation and TGS Landing Zone
To understand the impact the new seismic data had on drilling programs, we conducted an analysis within the extents of the West Lindsey and West Kermit surveys that included wells starting production in or after 2010. Historic and forecasted production statistics are all sourced from TGS Well Data Analytics. Documentation on the lease-to-well allocation and production forecasting processes are available via the TGS website. TGS stratigraphic models, based on the industry’s largest library of digital well logs, allowed for an accurate determination of the landing zone of each well (“TGS Landing Zone”).
Looking at the well inventory, we can split the dataset into two groups: operators that licensed the seismic surveys and based their development plans on the data, and operators that did not. Within each group we can evaluate the wells that were drilled before and after release of the seismic to identify changes in drilling strategy and quantify the impact of those changes. By comparing aggregated well performance statistics for these four sets of wells we can see that operators who licensed the seismic surveys performed better across the board, with higher initial production rates and ultimate recoveries than wells drilled by operators who did not license these surveys (Figure 4).
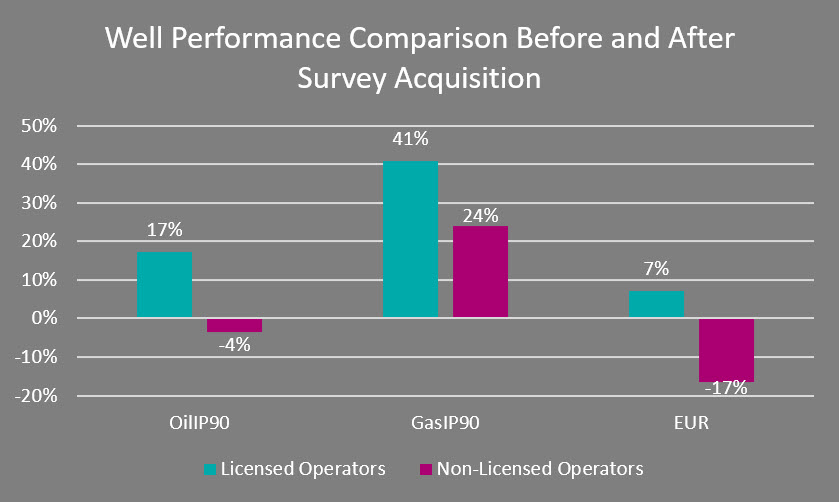
Fig 4 – Operator Comparison Results
First, let’s investigate changes in landing zone and benches targeted for development in a specific scenario with a licensee, Operator A, and a non-licensee, Operator B. Both operators have consistent development schedules over the entirety of our study time period, have acreage located very close to each other, and are producing around the same order of magnitude of production (Figure 5).
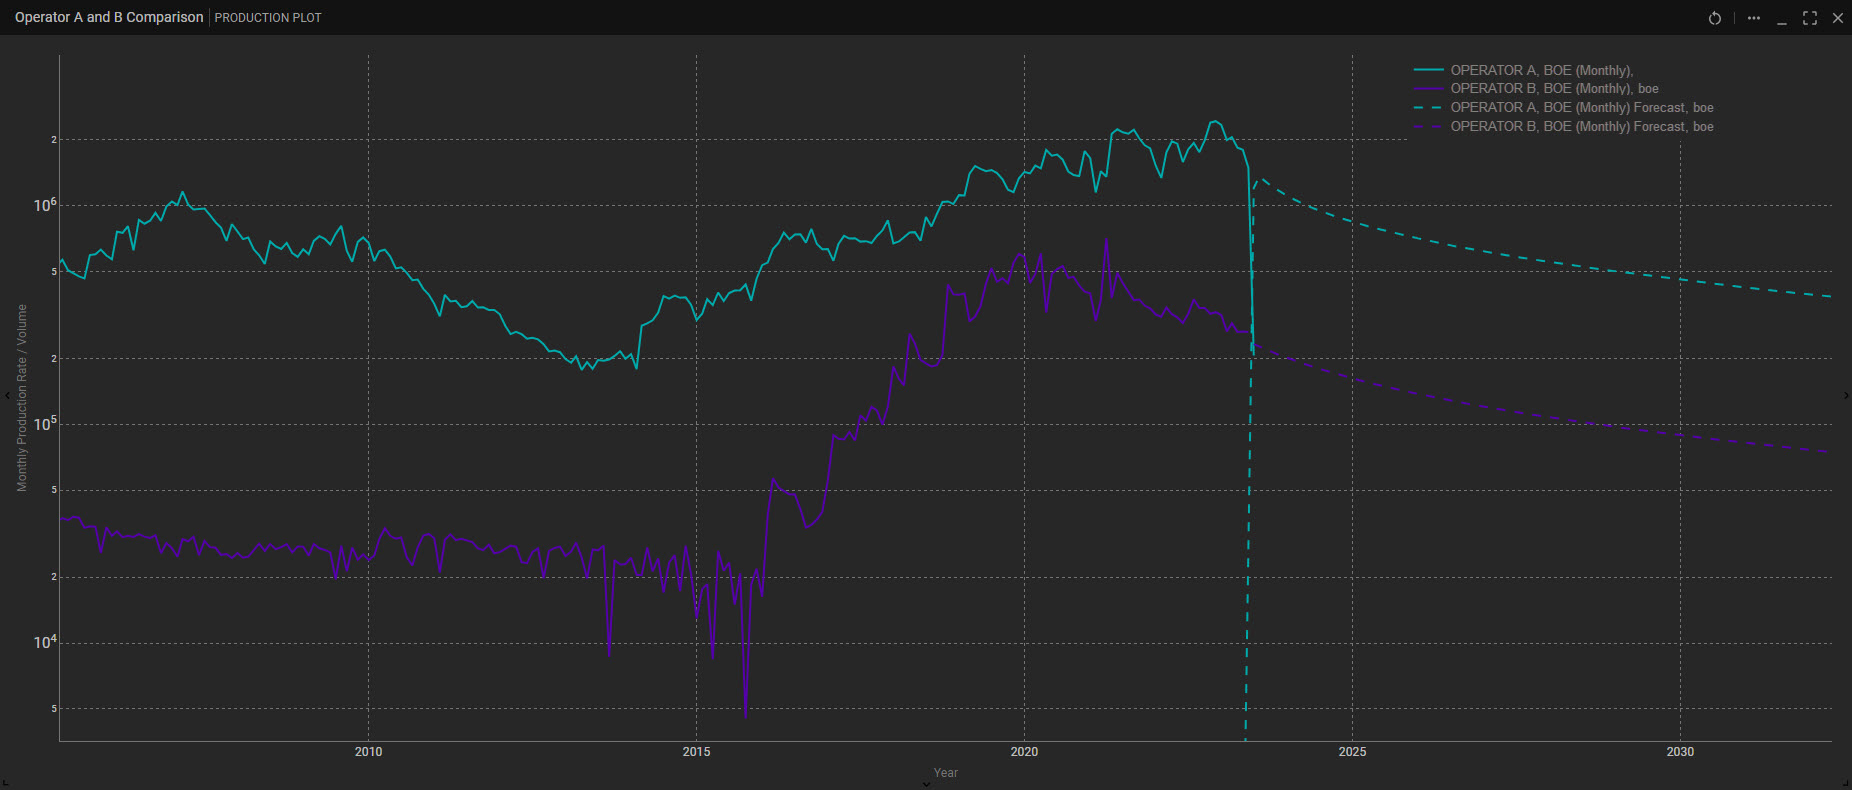
Figure 5 – Operator A to Operator B overall comparison
Prior to the survey acquisitions both Operator A and Operator B primarily targeted the Wolfcamp Shale and Wolfcamp B landing zones, with Operator B also targeting Wolfcamp C and 3rd Bone Spring Sand to a lesser extent (Figure 6). After the surveys were acquired, licensed Operator B continued with about the same distribution of landing zone targets. However, Operator A changed their strategy and started landing more wells in the Wolfcamp A, Wolfcamp X, and Wolfcamp Y intervals (Figure 7). This is a telling strategy shift because the Wolfcamp X and Y benches in this area are less than 50 feet thick, making them much more difficult to accurately land without structural guidance from high-resolution seismic. The Well Data Analytics gun barrel diagram shows how these wells can be spaced and stacked in these tight benches (Figure 8).
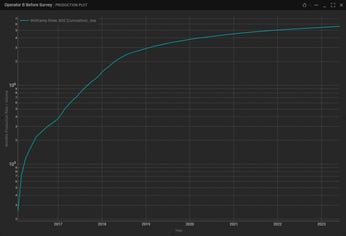
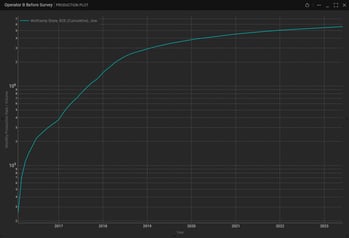
Figure 6 – Operator A and B before surveys
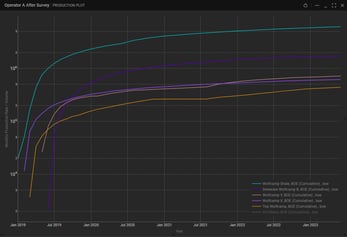
Figure 7 – Operator A and B after surveys
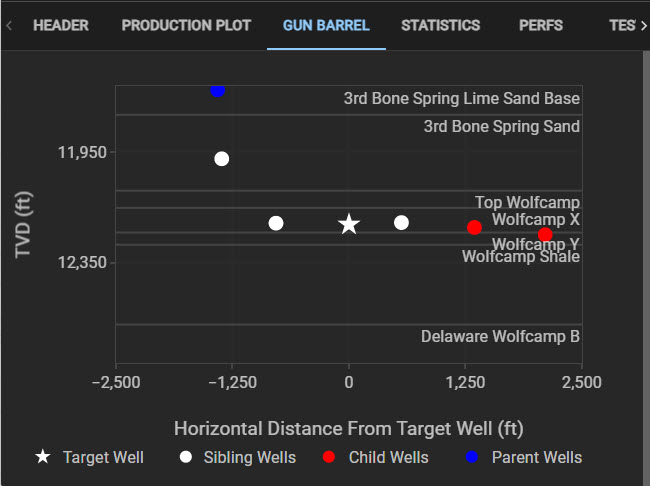
Figure 8 – Wolfcamp X and Y Well Spacing
The seismic cross-section in Figure 9 shows this stacked play in higher detail, with wells landed in each of the benches. We’ve primarily discussed the Wolfcamp landing zones so far, but the same principles apply to the shallower Bone Spring zones, with Figure 10 showing another seismic cross-section, with wells landed in specific Bone Spring intervals. Landing zone decisions are also driven by geomechanical attributes for which operators used elastic inversion products produced for the surveys. Elastic properties of the rock will drive perforation strategies and frac design. While a deep dive into the geomechanics is reserved for a follow-up paper, we can investigate changes in completion design using TGS Well Data Analytics.
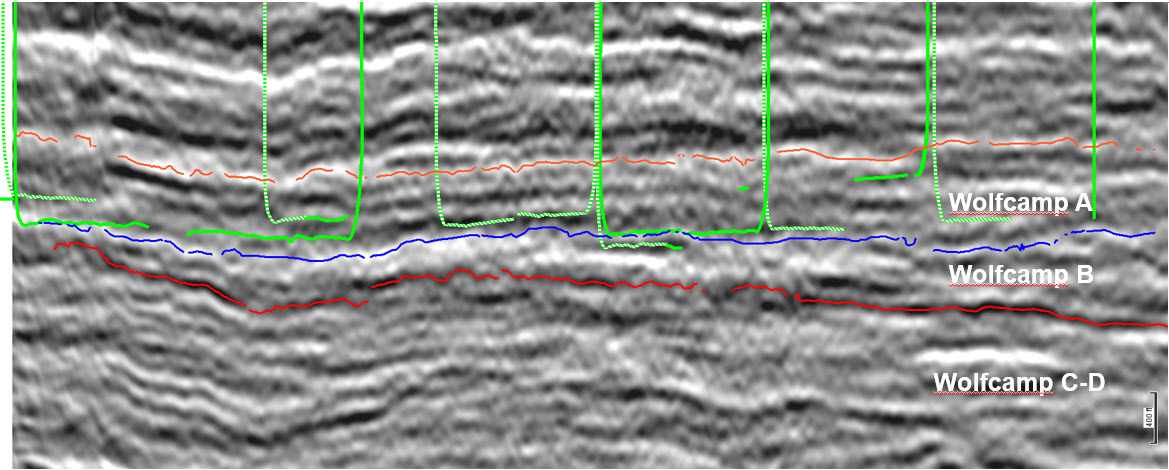
Figure 9 – Wolfcamp Cross-Section with Well Paths
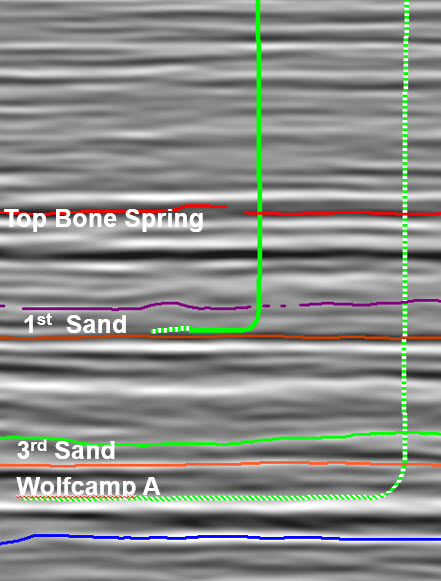
Figure 10 – Bone Spring Cross-Section with Well Paths
The completion parameters that are often determinative of productivity include lateral length, proppant/ft, and fracture fluid/ft. As shown below in Figure 11, there’s not a huge gap between licensees and non-licensees. There could be an argument made that around the time of survey acquisition, licensees identified an optimal lateral length of 8000 ft and proppant load of around 2250 lb/ft while non-licensees continued to experiment and fluctuate, but that could also just be noise or individual operator preference.
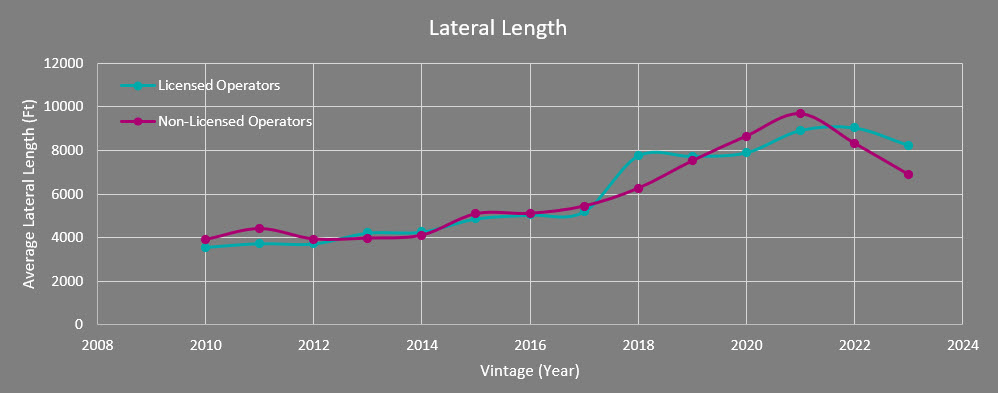
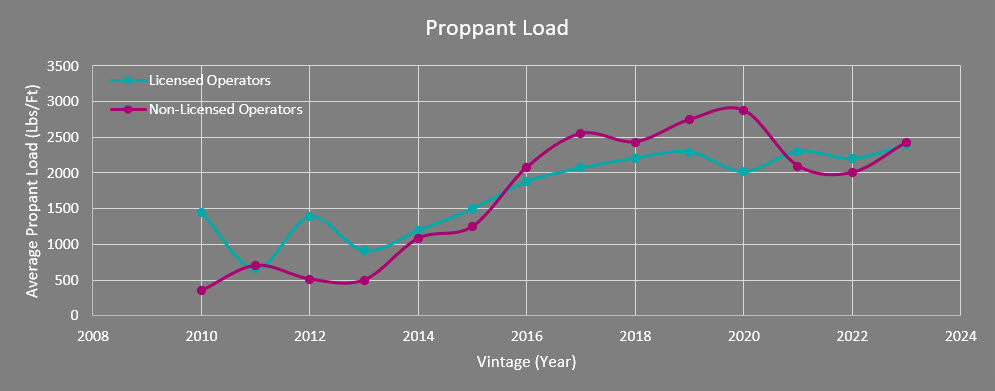
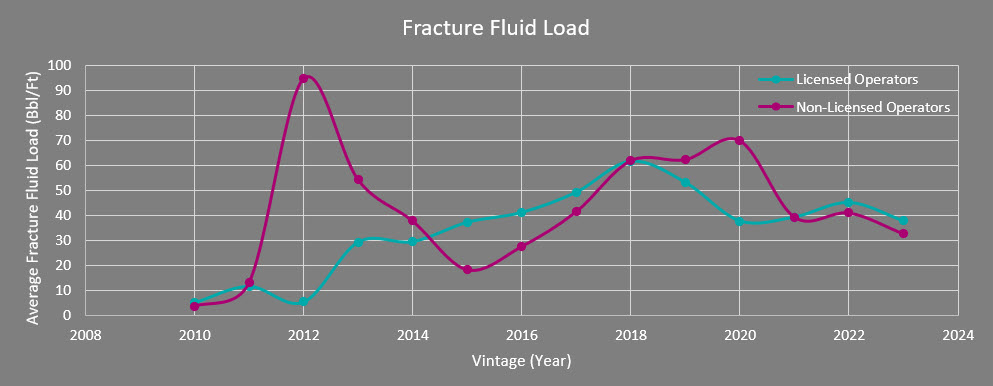
Figure 11 – Completion Design Comparison
Finally, the most important factor is how this impacts overall well economics. Using type wells from this dataset and conservative economic assumptions and price schedules from the upcoming TGS Well Economics data model, we’ve built FCF and NPV models for comparison. The results show that average post-survey production from Operator A, who licensed the surveys, resulted in an additional projected $1.5 million NPV per well over pre-survey wells, or a total of about $30 million in additional NPV for the 20-odd wells drilled since licensing the data. This amounts to an over 20% increase in economic performance when compared with pre-survey wells, and an over 35% increase in economic performance when compared against post-survey wells from operators that did not license the surveys (Figure 12). Interestingly, operators that did not license the surveys saw their economic performance decline due to higher capital costs from longer laterals without sufficient improvement in well performance. With these incremental increases in profitability, even a modest drilling schedule would more than cover the cost to license a 3D seismic survey.
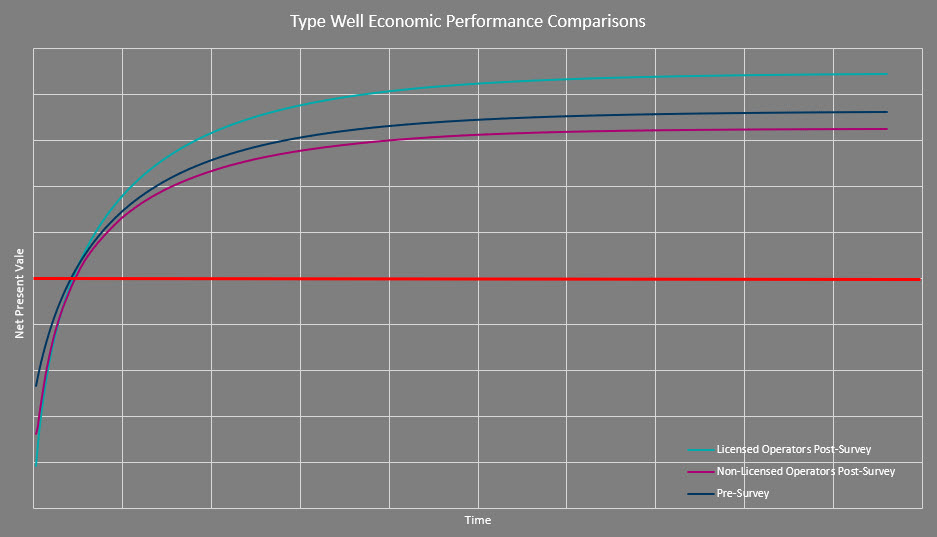
Figure 12 – Economic Comparison
The primary question we tried to answer in this analysis was the following: can we quantify the value of modern high-resolution 3D seismic by identifying changes in drilling programs attributable to utilization of the seismic data? We evaluated completion design, landing zone selection in stacked plays, and well economics and found that operators were able to develop additional landing zones and the wells drilled with the assistance of seismic performed measurably better than the alternative. For one operator, the additional NPV for the incremental production from wells drilled using the seismic since licensing of the data was around $30 million, which provides for a healthy return on investment. An additional takeaway should be that this type of workflow can be completed using TGS Well Data Analytics to perform a wide range of benchmarking, optimization, or sensitivity analyses.