The economic impacts of the pandemic and ensuing recession in the first half of 2020 are not yet entirely clear. Capital markets are showing signs of recovery, but consumer demand will likely lag for some time. Similarly, oil prices have partially rebounded to marginally economic levels. Still, many analysts believe that, without significant gains in oil price, the market and price volatility of March and April 2020 will continue to have a depressing impact on drilling and rig activity throughout the rest of the year. Although the expected energy demand is unclear and dependent on the overall economic recovery, some analysts have predicted that US output will need to stay above 10 million barrels of oil per day. We’ve used the TGS production and forecasting databases to model total US oil production based on drilling activity and have estimated that onshore rig count will need to stay at approximately 300 total rigs to maintain 10 million barrels of oil per day by the end of 2020. This is one of three scenarios we modeled, including a more optimistic and a more pessimistic option, to understand the impact of steadily dropping rig counts on domestic oil production.
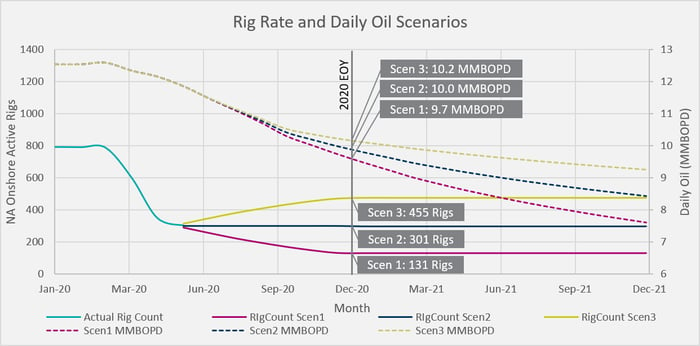 Figure 1 – Rig Rate and Daily Oil Scenarios
This model, created with the TGS Well Performance database, uses a combination of historical production, forecasted production for existing active wells, and composite basin type curves for new wells drilled. The US was subdivided into major plays based on the Baker Hughes rig count by basin. Reported rig counts were used until June 1st when we started forecasting total rig counts, keeping the proportions of rigs for each basin relative to the total number of rigs constant. Figure 1 shows the total historic rig count, followed by our three forecasted scenarios. Scenario 2 assumes the active rig count remains steady at 300. In contrast, Scenario 1 assumes a continuation of the current trend with 3% weekly declines, and Scenario 3 assumes a conversely slow rise in rig count. Table 1 shows our forecasted results, as visualized on the second axis of Figure 1. Figure 2 shows how each of the pieces of this model contributes to the total oil output, with the marginal increases for each of the scenarios layered on top of each other, and Figure 3 shows how the production breaks down among the defined basins. Extending this forecast into 2021 shows the continual production drop-off, with daily oil rates between 7.6 and 9.3 MMBOPD by the end of the year.
As visualized in the production breakdown by basin, the Permian basin has an outsized impact on the overall US production. One interesting insight on the Permian performance is that, of the total US production decline from currently producing wells over the 2-year forecast, the Permian accounts for 55% of that decline. However, in production from new wells driven by rig rates in scenario 2, the Permian only account for 33% of new US production. Given the typical Permian high initial flow rates and steep decline rates, this outcome is to be expected. Without higher levels of Permian drilling to level off production replacement, the decline in Permian output will drive overall US production declines. The Permian is a double-edged sword, providing quick returns on new wells, but requiring exceptionally high drilling rates to maintain production.
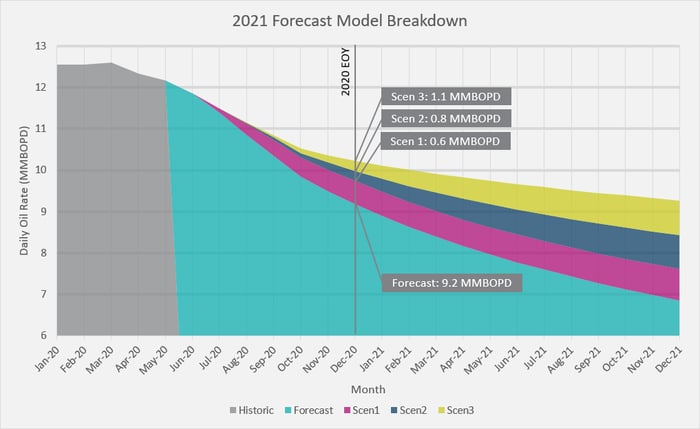 Figure 2 – 2021 Forecast Model Breakdown
This study assumes no change in production or completion strategies such as shutting-in wells or increasing DUC inventories. As discussed in previous insights, both strategies can temporarily delay production at a marginal cost to well performance. Anecdotal evidence indicates that some level of both strategies has occurred over the first half of 2020, but to what extent won’t be clear for another couple of months, at which point we will return to this assumption for further investigation. Another assumption made is that the proportion of rigs per basin remains constant. While the total rig count at the start of the forecast is 301 rigs, only 222 of those are classified as oil rigs, with the remaining 77 classified as gas rigs. The mix of rigs per basin is a trailing indicator of capital investment, and under new macro-economic conditions, operators will likely re-prioritize capital deployment based on cash flow and marginal profitability constraints.
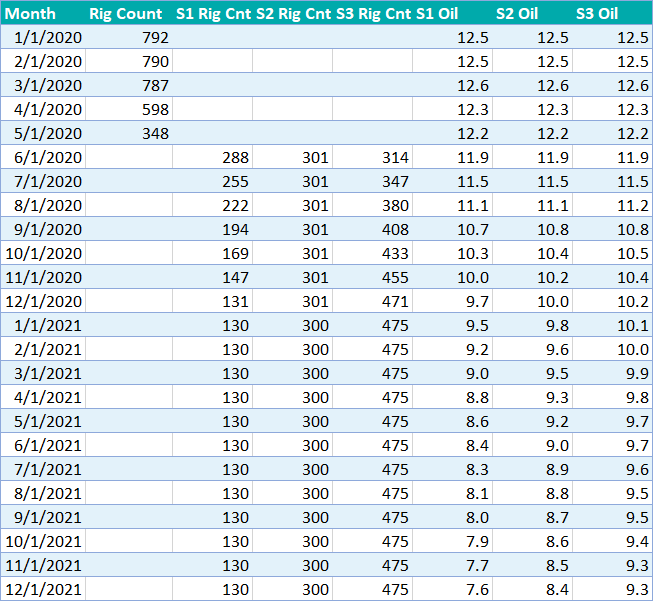 Table 1 – Rig Count and Daily Oil Forecast Results
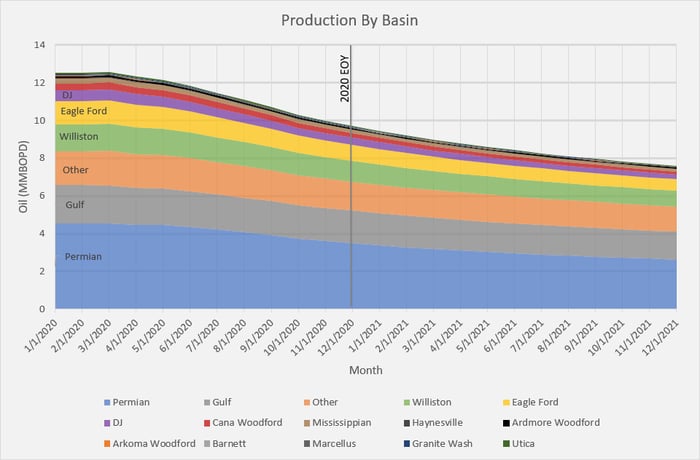
Figures 3 – Forecast Production by Basin