Appalachia Natural Gas Continues to Grow to Meet AI Supply Demands
Dec 12, 2025 - Antero’s $2.8 billion acquisition caps off busy M&A year for Marcellus Assets
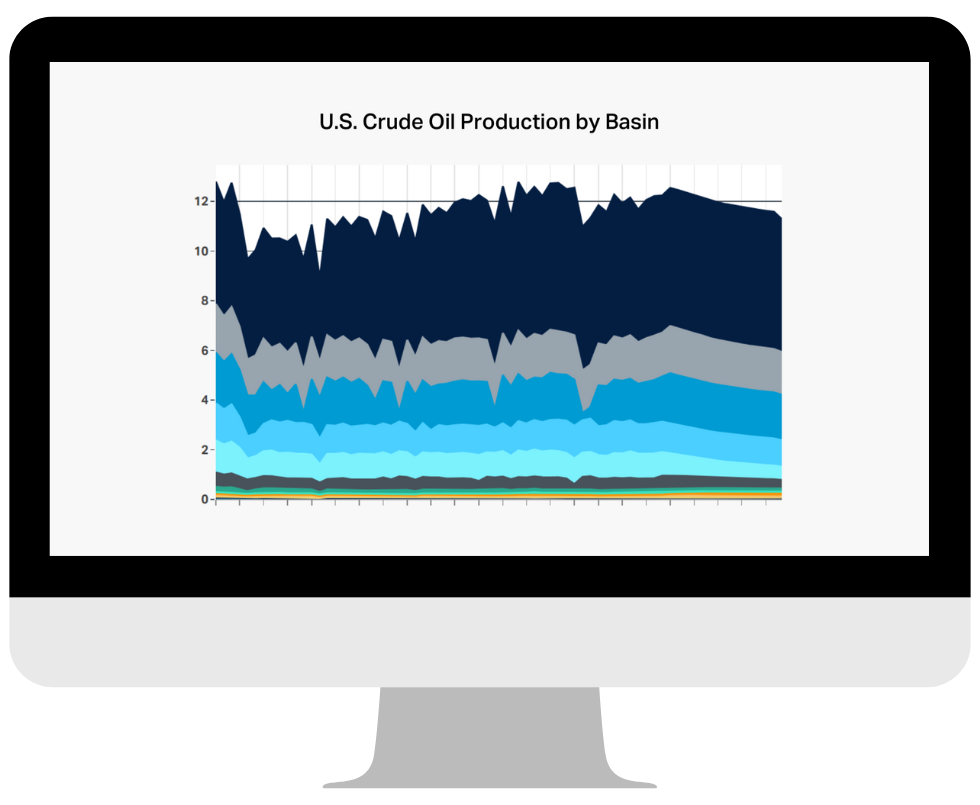
Read More >TGS Well Data U.S. crude oil production integrates historical data, active well projections and new well estimates to deliver valuable insights for industry investments and strategic planning.
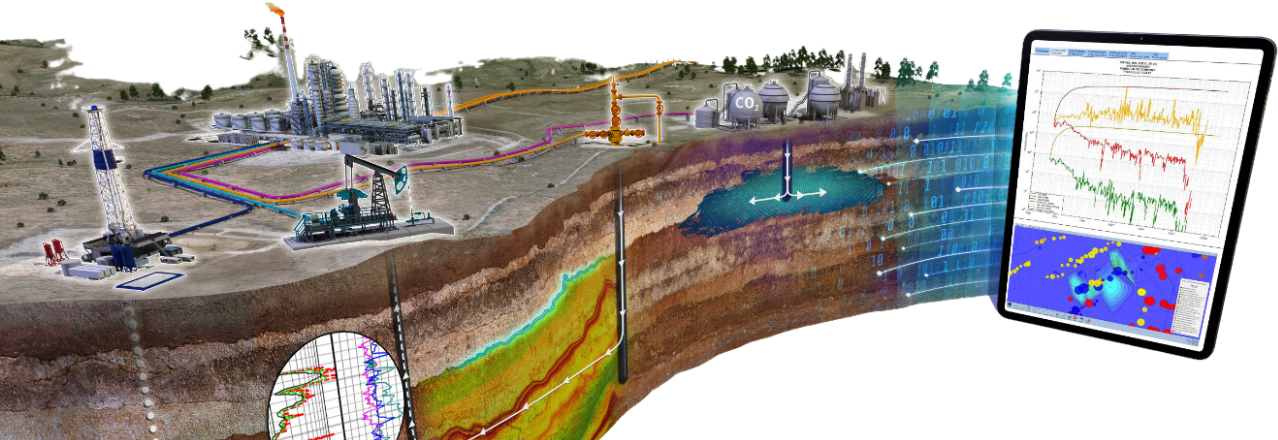
A leader in subsurface data technology, we combine unparalleled amounts of well data and geological data over the asset lifecycle with advanced cloud-based analytics. We ensure integration into customer workflows through expert subsurface data management and delivery via API (incl. OSDU), SQL Direct Connect, export formats and loaders.
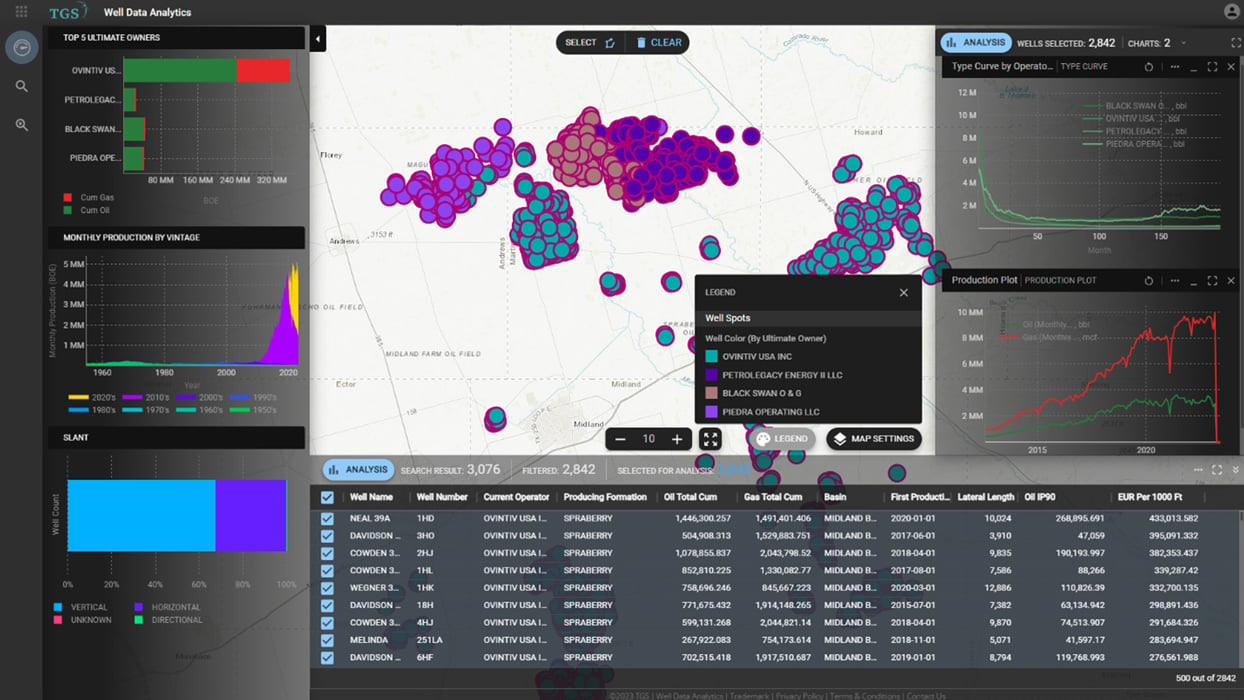
Benchmark, predict, and optimize well performance in all U.S. basins using our cloud-based oil and gas analytics platform, Well Data Analytics. The application combines our comprehensive subsurface database of oil and gas production with geological mapping, powerful visualization, and user-favorite workflows from TGS Longbow.
Exploration
Development
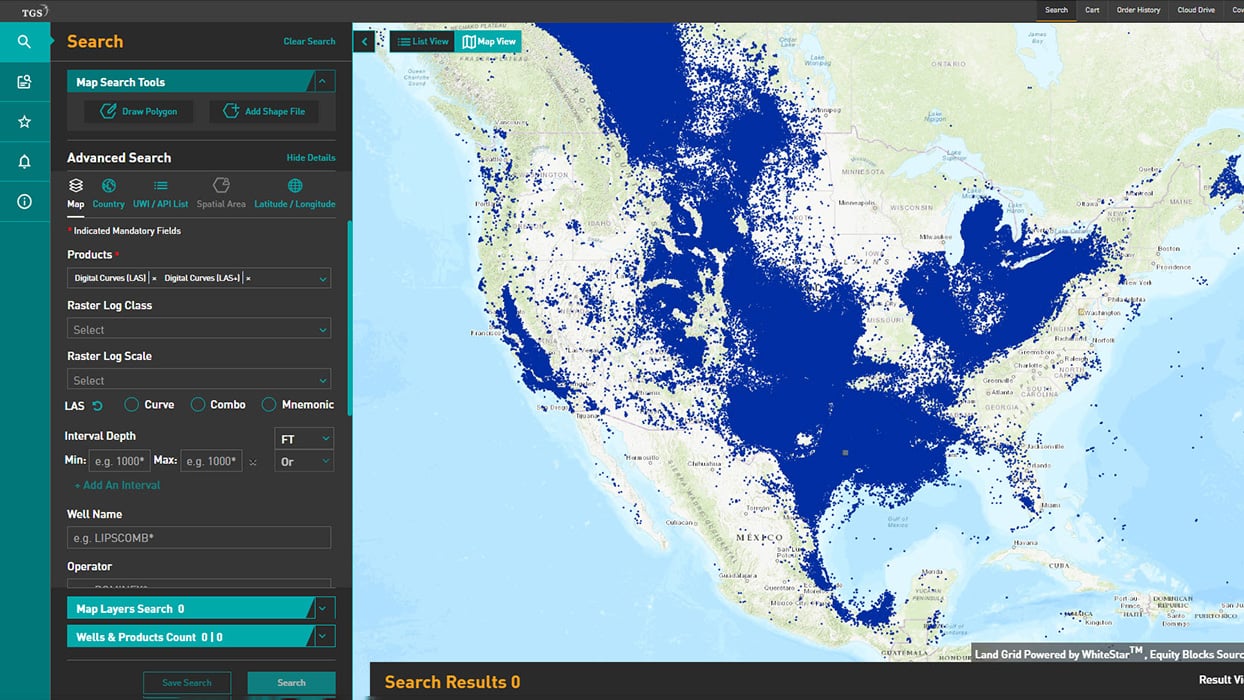
Search, purchase, and manage geological data from the world's largest well log subsurface database in TGS R360. Click through millions of processed raster logs, digital logs, and geological interpretations in U.S. and international basins.
Exploration
Development
Stay up-to-date with subsurface data technology. Oil and gas news at your fingertips through our daily and weekly newsletters.
Dec 12, 2025 - Antero’s $2.8 billion acquisition caps off busy M&A year for Marcellus Assets
Read More >Dec 05, 2025 - How Geology and Well Results Converge to Define the 2nd Bone Spring’s Core Potential
Read More >Dec 01, 2025 - Two years after expanding their eagle ford position, Baytex is now exiting the play
Read More >
A recent American Association of Petroleum Geologists (AAPG) article highlights how our integration of log-derived multi-variate modeling enhances subsurface interpretation and forecasting. Our approach offers petroleum geologists and engineers a well-rounded understanding of geological formations, leading to more effective development and production strategies.
Stay informed with our Industry Updates e-newsletter, delivering fresh insights into competitive operator strategies and drilling trends, along with breaking news from the industry. Dive into our Weekly Spotlight every Friday for expert analysis and valuable perspectives from TGS' subject matter experts on the latest industry developments.

For geologists and engineers, accurate reservoir characterization is often the difference between economic success and failure. One of the main tools to reduce reservoir uncertainty is drill stem tests (DSTs) which provide key information about formation pressure and fluid characteristics of the reservoir.
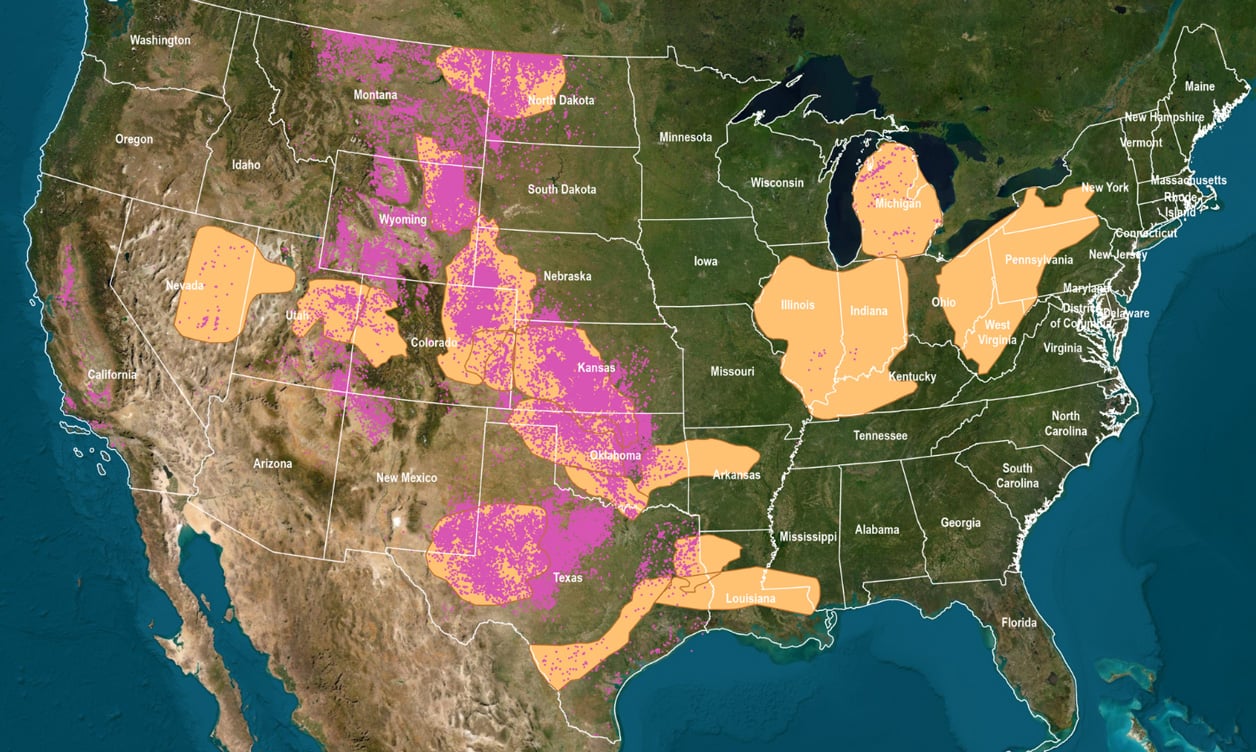

The world's largest collection of subsurface data types. Up to 7x more data than the competition where you need it most.

Processed, interpreted, and quality-controlled by hand. Proprietary subsurface data management solutions ensure that all data over the asset lifecycle is matched and mastered to one validated well header.

Designed by customers for customers. Data delivery, processing, and subsurface data management can be customized to your specifications. Flexible subscription and licensing terms.
Subsurface data is a cornerstone in the oil and gas industry, influencing every stage from exploration to eventual well abandonment. With the industry rapidly embracing digital advancements, analytics-ready datasets like TGS Well Data Products have become indispensable tools for operational excellence and strategic foresight.
Subsurface data is essential for informed decision-making, strategic planning, and performance optimization. It spans an extensive spectrum across geological, drilling, production, and environmental data. Comprehensive oil and gas datasets like TGS Well Data Products can inform every stage of the oil and gas lifecycle. Engineers and geoscientists can utilize the data for reservoir modelling, simulation, and optimization. TGS data aids in identifying drilling prospects, evaluating reservoir performance, planning well spacing, and managing production.
The use of oil and gas data extends beyond operational aspects, serving as a powerful tool for managing risk, ensuring regulatory compliance, supporting sustainability initiatives, and informing investment decisions. As the industry moves toward digital transformation and increasingly adopts data-driven technologies such as AI and Machine Learning, the significance of analytics-ready oil and gas data will continue to grow. This transformative shift underscores the crucial role of high-quality subsurface data to support decision-making in the modern oil and gas industry. TGS data is optimized for Machine Learning and is delivered analytics-ready.
Effective subsurface data management helps our customers streamline operations, enhance productivity, and optimize their exploration and production strategies. TGS ensures that every stakeholder can access a holistic view of an oil well's lifecycle, from discovery and drilling to production and eventual abandonment, thereby driving data-driven decision-making in the industry. Rigorous subsurface data management supports regulatory compliance and reporting by consolidating records required by regulatory bodies, acting as a central hub for environmental, safety, and health-related data, allowing our customers to monitor and improve their practices in these areas.
Interested in a product demo or trial? Let us know your needs and we’ll connect you to the right person on our Well Data Products team.