Ranking tiered acreage for the emerging Permian Barnett and Woodford plays.
In March of this year the EIA refined their Short-Term Energy Outlook (STEO) model for Permian tight oil and shale gas to include the Barnett and Woodford plays, along with 2 other Permian plays. This follows the release of a USGS assessment of undiscovered resources in the Permian Barnett and Woodford plays in January of this year. TGS has written previously about the developing Permian Barnett and Woodford plays (Deep Barnett & Permian Barnett and Woodford). But with exploration and development accelerating, and this change to the EIA STEO confirming that these emerging plays warrant a more detailed evaluation, our extended analysis of the core play areas indicates there could be upwards of 1.8 million acres of top-tier Barnett and Woodford inventory across the Permian.
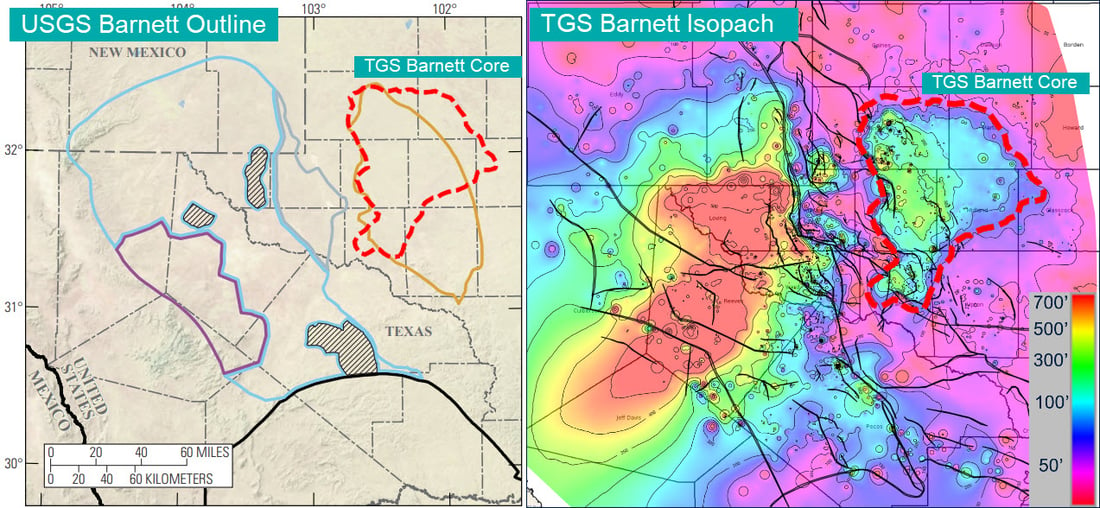 Figure 1: Comparison of USGS and TGS Barnett Core Play Extent
 Figure 2: Comparison of USGS and TGS Woodford Core Play Extent
In our last article on the Permian Barnett and Woodford, we compared the USGS main play outline with the TGS core fairway interpretation (Figure 1 and Figure 2). The extended petrophysical interpretation completed for this new analysis was done with the goal of identifying the top-tier acreage of the Barnett and Woodford plays. The Barnett and Woodford ranking map scores each well on seven weighted parameters: reservoir-gated porosity (PhiT within gross reservoir intervals passing a Vclay cutoff), clay volume, TOC, net pay thickness, overpressure conditioned on net pay presence, mineralogy-based brittleness, and water saturation within net reservoir. Each parameter is scored on a 1–4 tier scale and summed into a composite index. Firm boundary conditions eliminate wells deeper than 17,000 ft or with overpressure below 1,500 psi, reflecting a theoretical minimum pressure support required for economic unconventional production on the CBP. The reservoir-gating approach evaluates porosity and saturation only within intervals that pass clay and porosity cutoffs rather than using zone averages, which is critical in a mixed shale-quartz-carbonate system where zone-average properties are dominated by tight, clay-rich matrix and mask the quality of discrete reservoir windows. Using this methodology we created a new map, with the top 3 rankings considered to be high-quality. Overlaying drilled and producing Barnett and Woodford wells, colored by forecasted performance, indicates a high correlation between the TGS ranking methodology and well performance (Figure 3 and Figure 4).
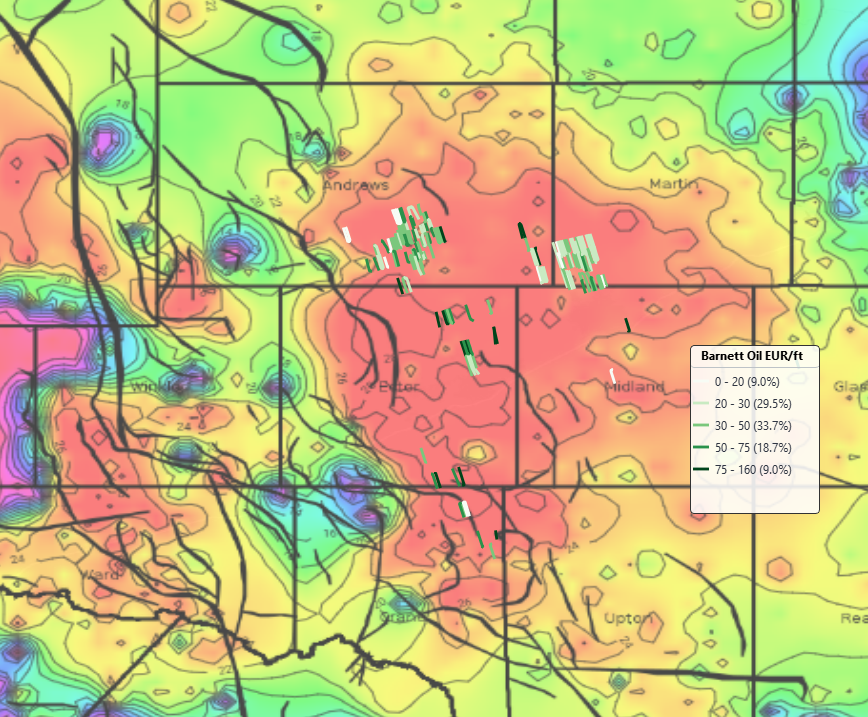
Figure 3: Barnett Ranking Map with Existing Well Performance
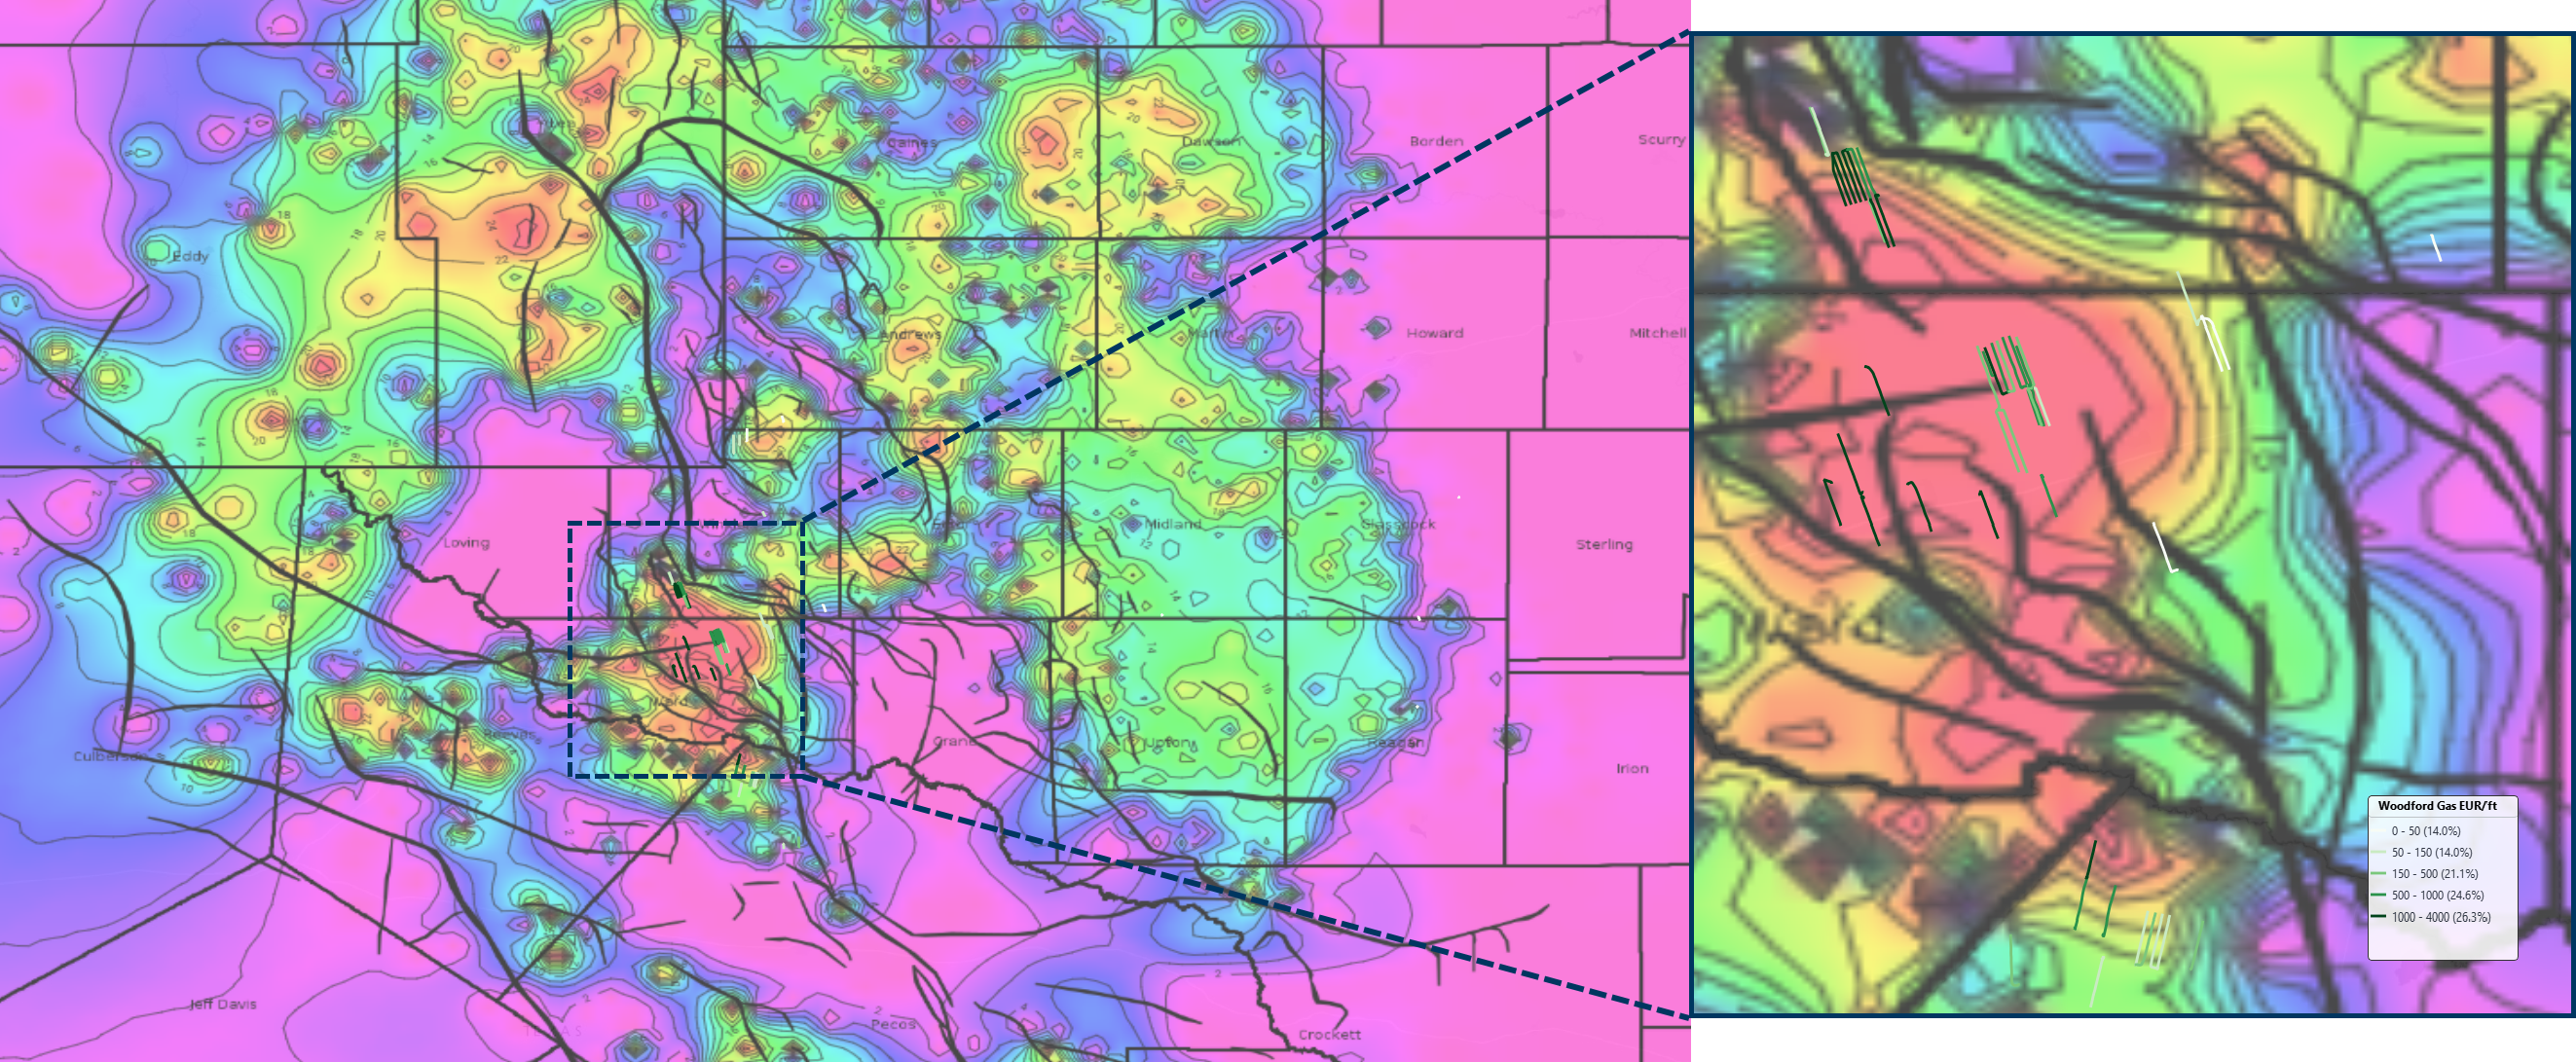
Figure 4: Woodford Ranking Map with Existing Well Performance
The USGS study documents the approximate play areas for both plays. Summed across all assessment units they calculate a mean area of 5.21 million acres for the Woodford and 4.77 million acres for the Barnett. The TGS-interpreted high-quality play includes 580 thousand acres for the Woodford and 1.3 million acres for the Barnett. As these plays develop, and as new logs and well performance results are made available, we plan to continue to refine and update this interpretation.
For more information about TGS Geological Data and Interpretations, please contact us at WDPSales@tgs.com.