Chesapeake Energy Corporation and Southwestern Energy Company have entered into an agreement to merge.
According to news outlets, in October of 2023, Chesapeake Energy Corporation (CHK), a prominent domestic natural gas entity, initiated discussions with Southwestern Energy Company (SWN), a leading independent energy producer, regarding a potential merger. Notably, these discussions have intensified throughout this week and the two companies have agreed to merge in an all-stock transaction. Both CHK and SWN, as primary gas operators, have complementary acreage in the Appalachia Basin and Haynesville Play1. A successful merger between these entities substantially reshapes the current landscape of the natural gas production market, ushering in a new gas giant boasting a market capitalization exceeding $17 billion. This combined entity surpasses EQT Corporation’s market cap (EQT), presently valued at over $15 billion, thereby becoming the most valuable natural gas producer in the United States.
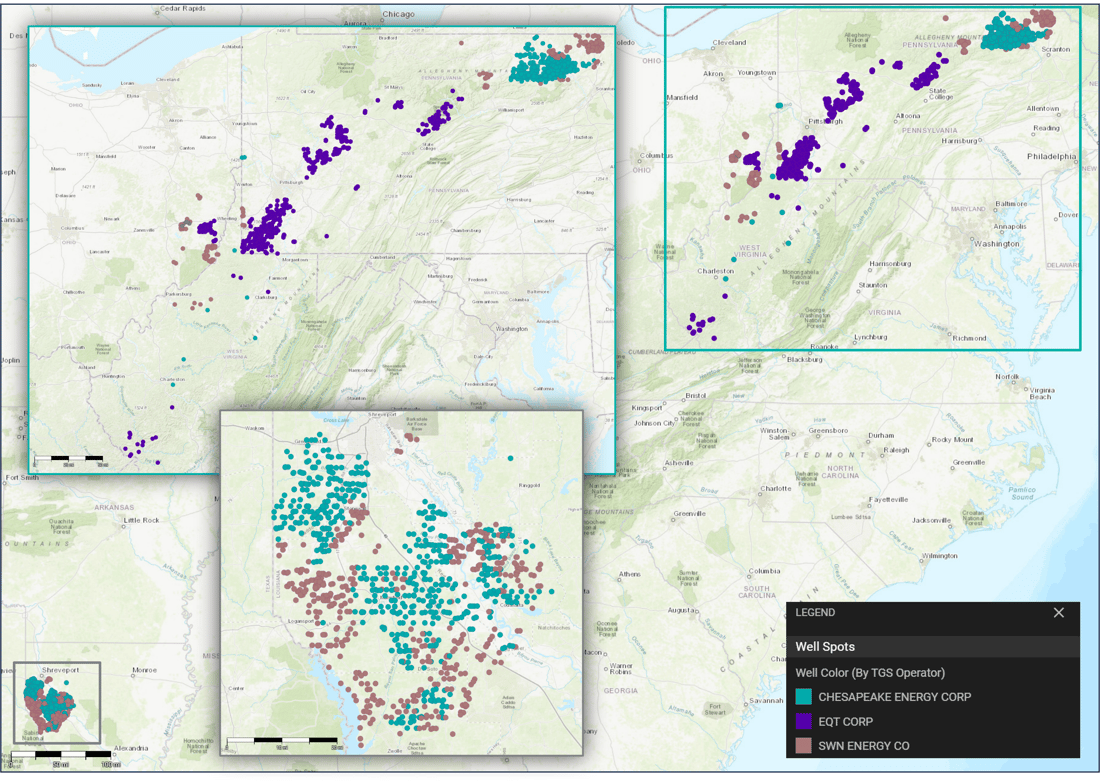
1Asset map showing the position of active and producing wells for CHK, SWN, and EQT in the Appalachia and Haynesville Basins. Map created using TGS Well Data Analytics.
A comparative analysis, using TGS Well Data Analytics, of type curves from recently drilled wells in the Appalachia Basin shows that EQT is currently the largest overall producer of the three (4.3 BCF/d), followed by CHK (4.1 BCF/d), and SWN (3 BCF/d). On a per-well basis, EQT wells yield the highest lifetime production (EUR), with CHK and SWN approximately equal. However, CHK wells tend to have higher initial production rates and higher decline rates2, while SWN wells have lower initial rates and lower declines to get to that equivalent EUR. In terms of remaining volumes from wells already in production, EQT holds the highest remaining reserves. It will be exciting to re-evaluate the natural gas landscape once CHK and SWN have completed the merger and to see if this sparks more consolidation in the natural gas industry with increased demand for LNG.
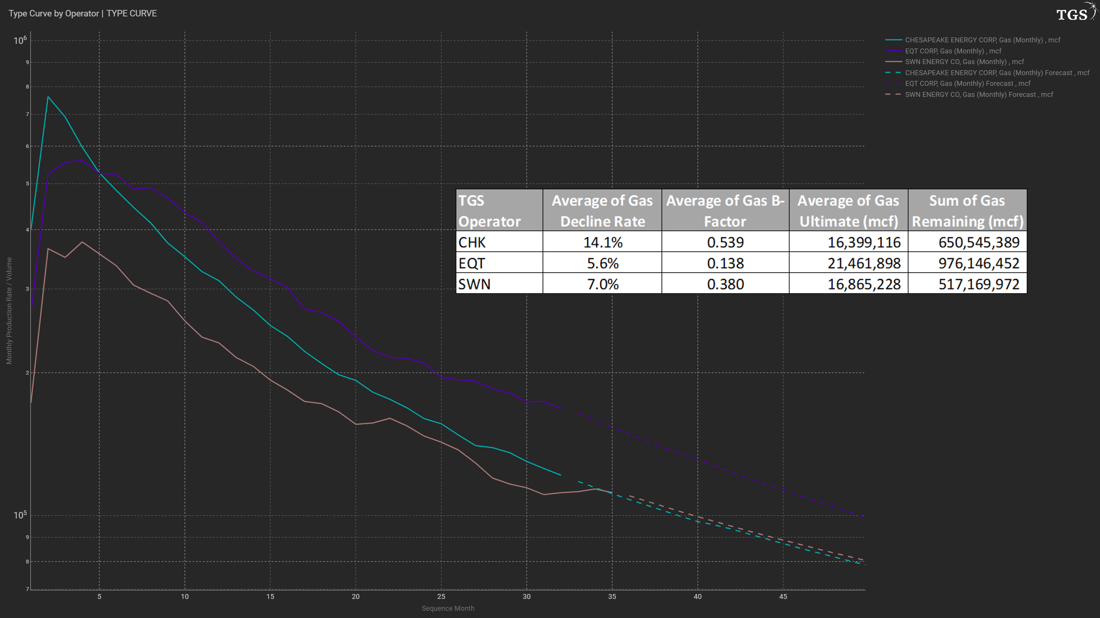
2Type curves for CHK, SWN, and EQT in recent years. Plot derived using TGS Well Data Analytics.
For more information on Well Data Analytics or to schedule a demo, contact us at WDPSales@tgs.com.