GOR distributions and spatial trends indicate increasing gas contribution in historically oil-dominated Wolfcamp and Bone Spring reservoirs.
Oil-targeted development in the Delaware Basin is increasingly challenged by rising gas–oil ratios, raising questions about fluid evolution and long-term oil yield across core benches. Analysis of cumulative GOR indicates that oil wells across the basin are producing materially more associated gas through time, with all major Delaware oil targets (Figure 1) showing substantial increases between 2012 and 2025. TGS data indicates GOR increased by 62% in the 2nd Bone Spring Sand, 96% in the 3rd Bone Spring Sand, 47% in the Wolfcamp A, and 99% in the Wolfcamp B, with the gassiest wells concentrated along the western Delaware Basin and the oiliest wells clustered near the Central Basin Platform reef margin (Figures 1 and 2). 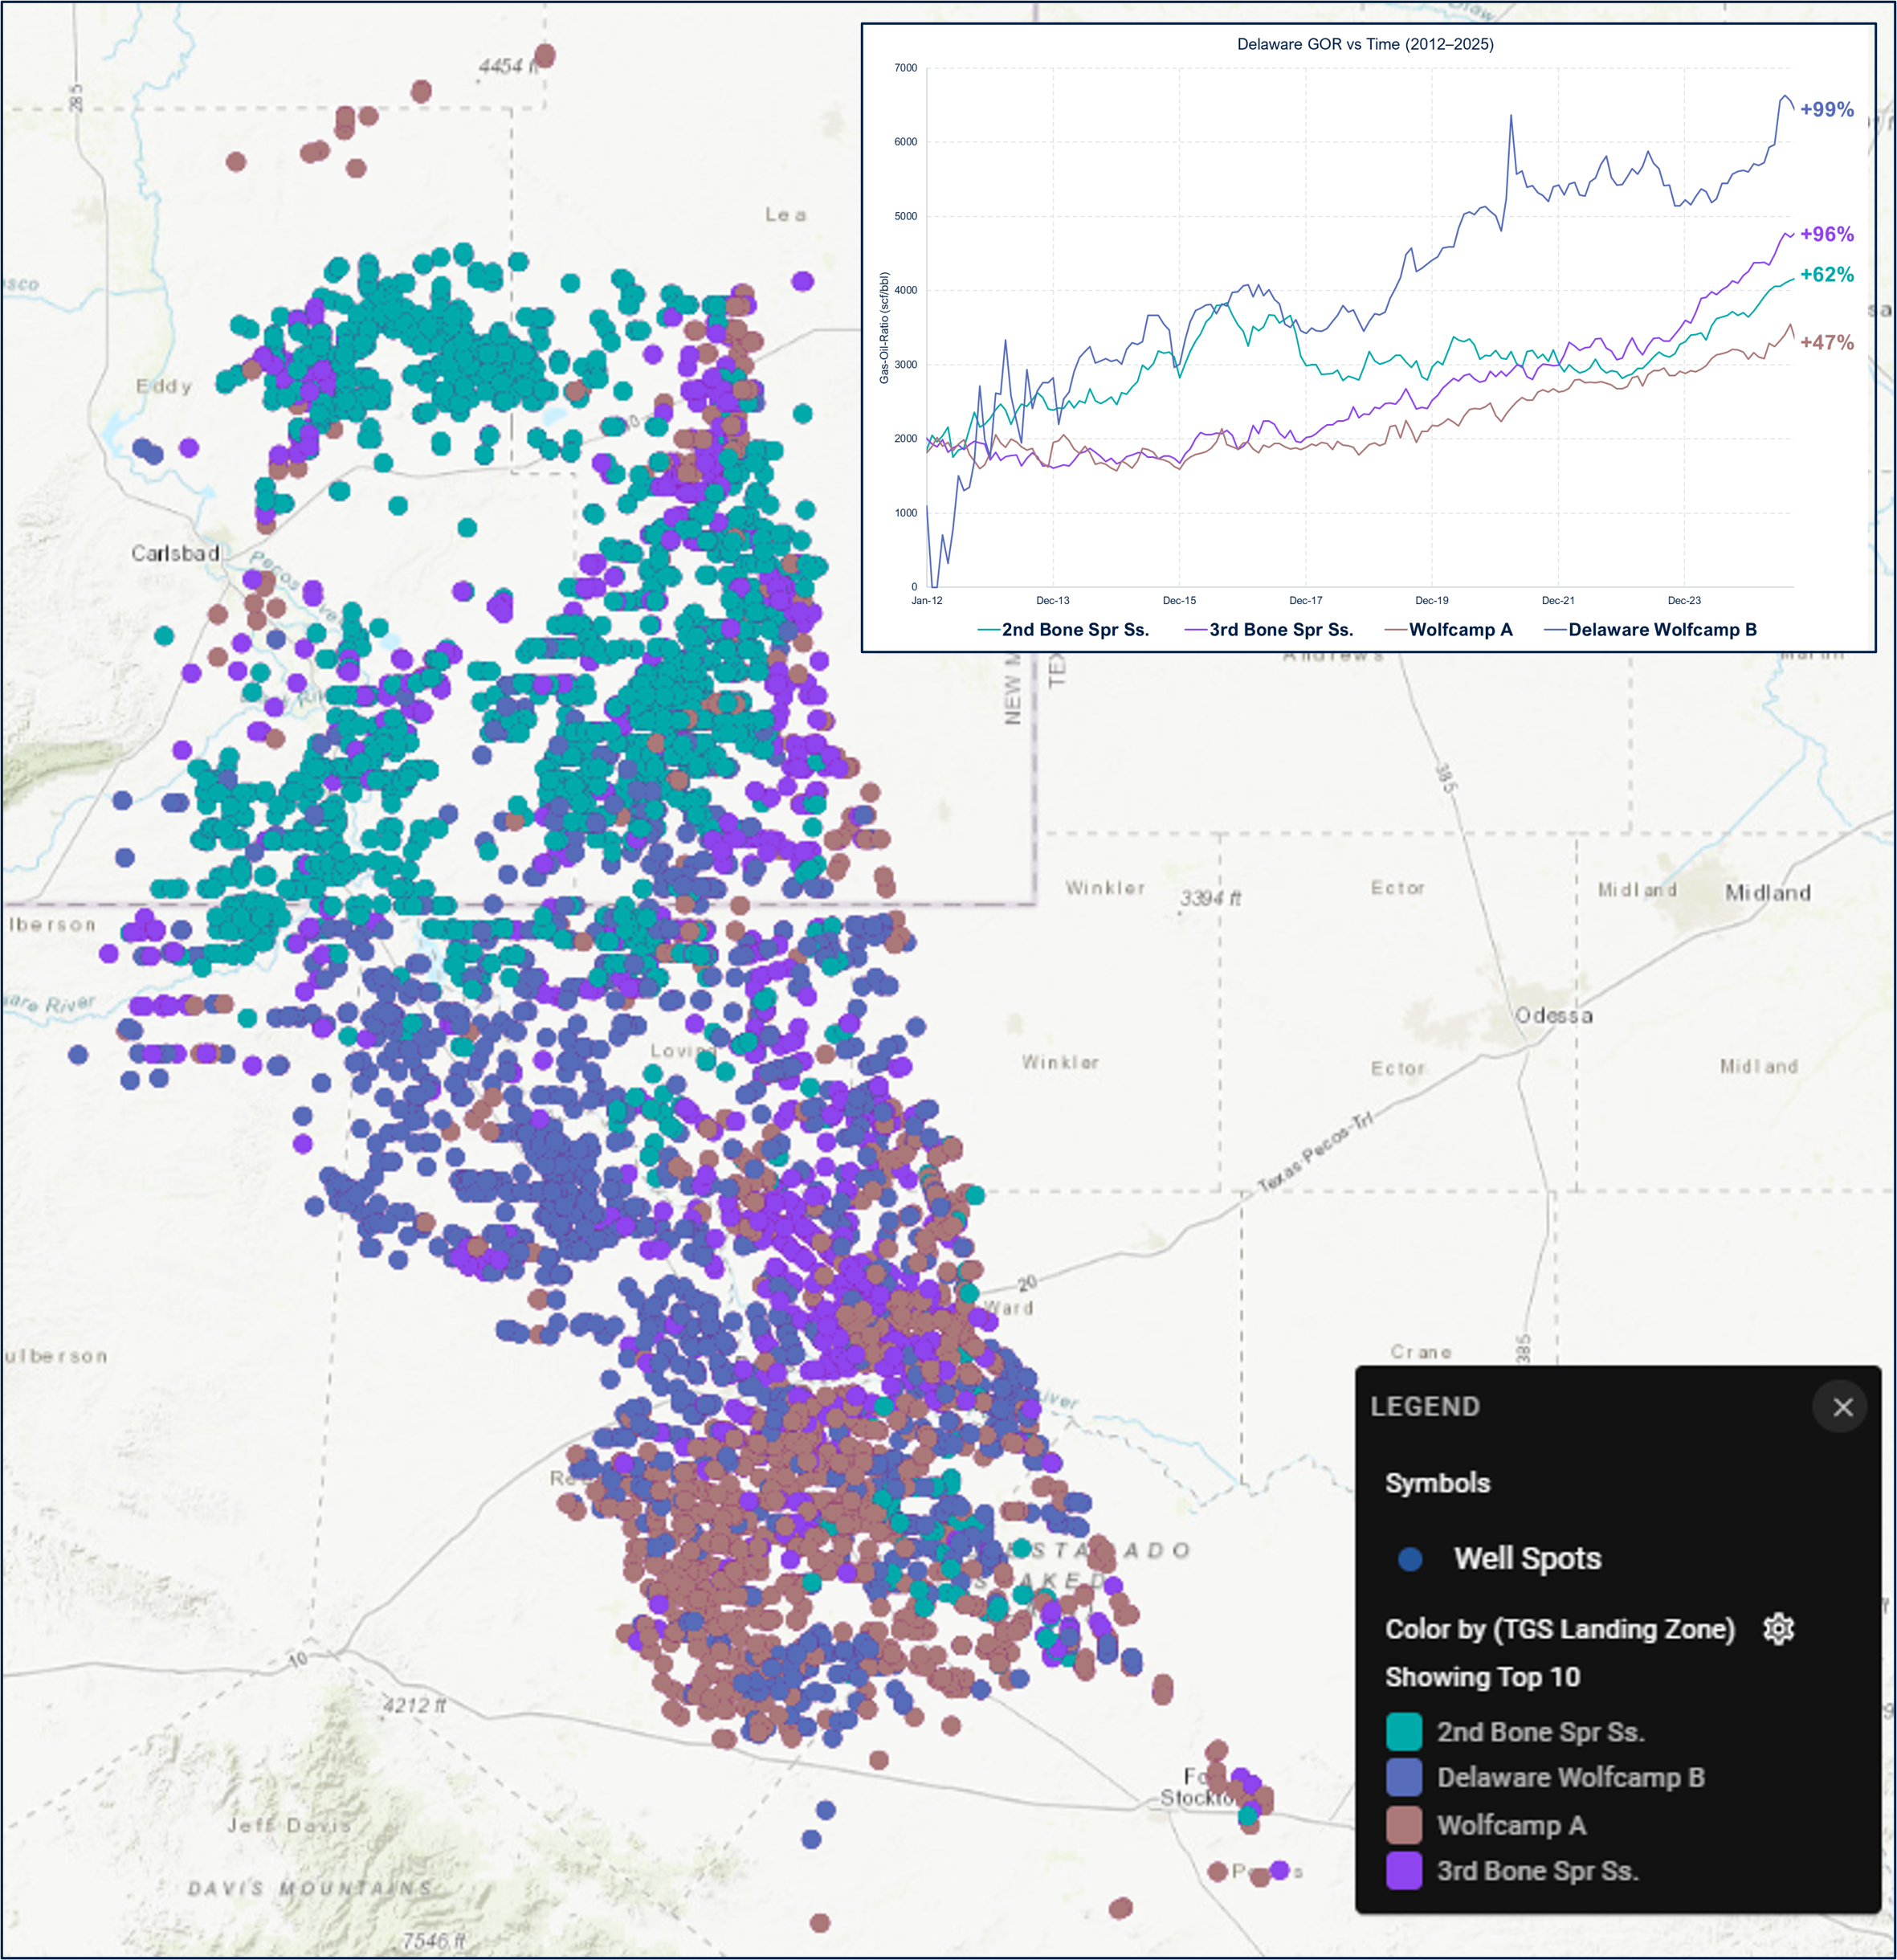
Figure 1. Well distribution map colored by TGS Landing Zone. Inset chart shows percent increase in GOR from 2012 to 2025 for each formation .
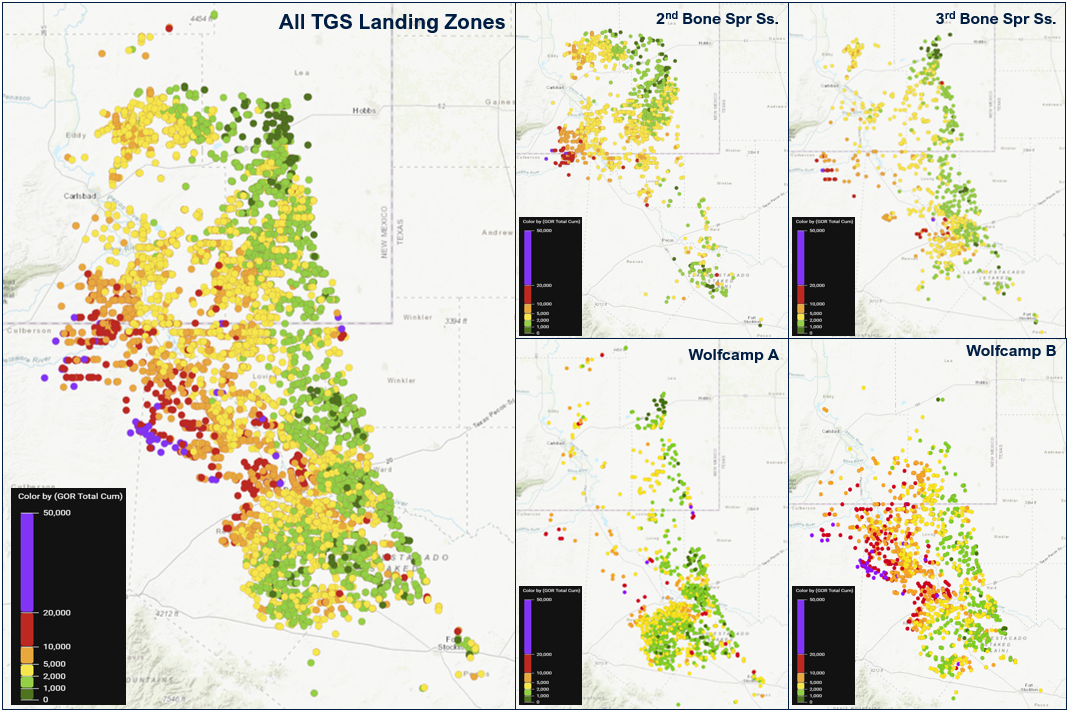
Figure 2. TGS Landing Zone GOR maps, Delaware Basin .
Well Data Analytics Performance Data reveals a consistent upward shift in the full GOR distribution across all formations, demonstrating that this trend is basin-wide rather than isolated to outlier wells or localized development practices. Maps show increasing GOR toward the western basin, where greater thermal maturity, deeper burial, and higher pressure gradients favor gas-rich fluids, while lower GOR values persist along the eastern Delaware Basin adjacent to the Central Basin Platform, where carbonate-influenced depositional systems and structural relief help preserve oil-prone conditions (Figure 2). The 2nd and 3rd Bone Spring Sands and the Wolfcamp A and B remain primary oil targets due to their regionally extensive, laterally continuous siliciclastic reservoirs, favorable porosity–permeability frameworks, and strong hydrocarbon charge, but the observed GOR evolution (Figure 3) suggests that changes in maturity, depletion, and fluid mixing are increasingly influencing production outcomes within these historically oil-dominated intervals. As new gas takeaway capacity and LNG export infrastructure expand and commodity prices diverge, rising associated gas may enhance project resilience by giving operators exposure to both oil and gas revenue streams that are not perfectly price-linked.
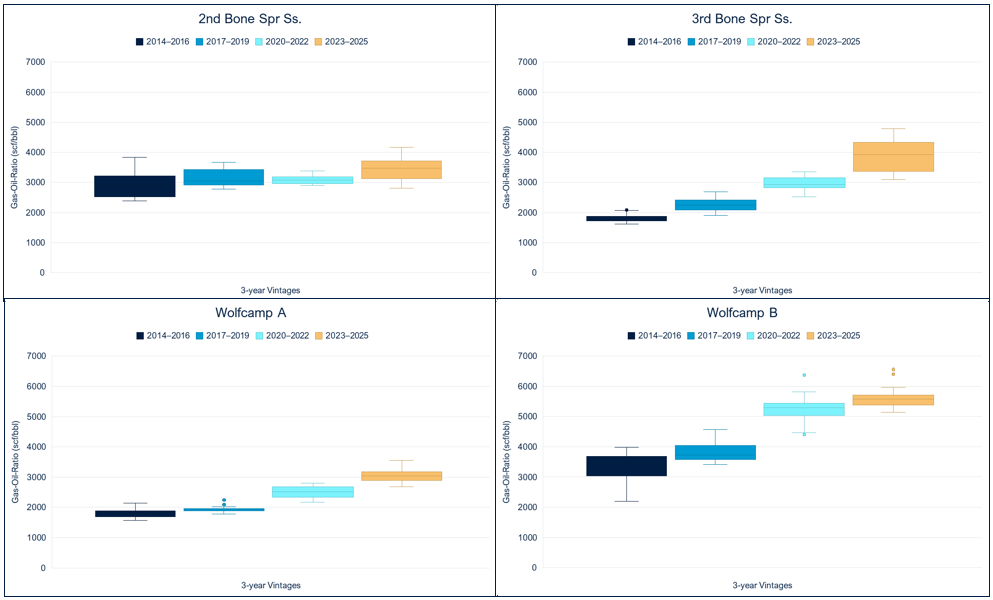
Figure 3. Distribution of cumulative GOR for Delaware Basin oil-targeted wells by production vintage. Box plots show median and interquartile ranges.
For more information about TGS Geological Data, TGS Well Data Analytics or to schedule a demo, please contact us at WDPSales@tgs.com.